Retirement Assessment

Know exactly where you can afford to retire.

Project your TSP and investments, add your FERS or military pension and Social Security, then compare your income against sourced cost-of-living data for every U.S. state and 130+ countries. Finish with a 1,000-path Monte Carlo and an 11-page personal report.

FREE Included at no extra cost with the Consultation plan ($40/mo).
One-time paymentInputs stay in your browserDownloadable PDF
tspmaxing.com/retirement
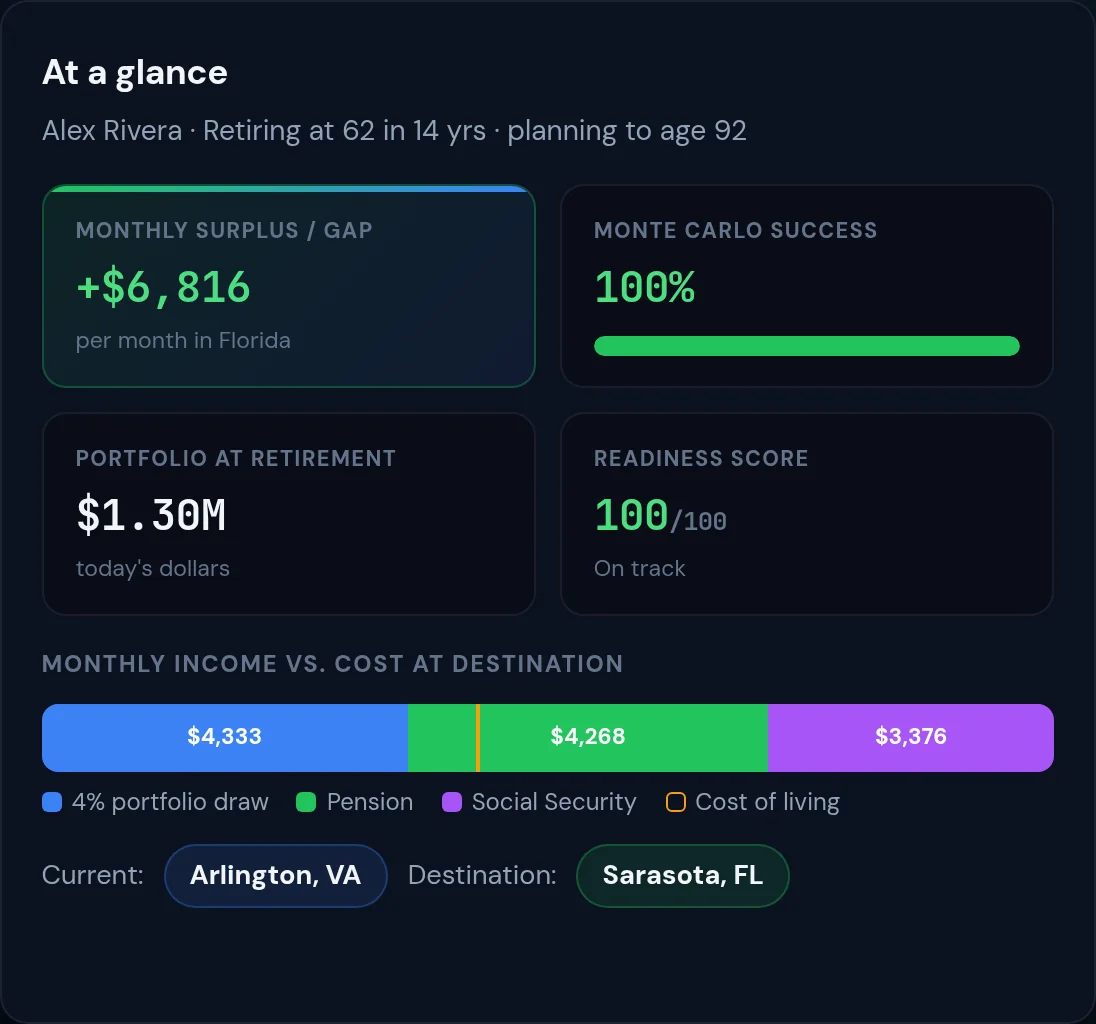
Retirement Assessment results dashboard showing monthly surplus, Monte Carlo success, projected portfolio and readiness score
Example data
Monte Carlo paths
1,000
Report
11 pages
Built on public data BLS Consumer Expenditure SurveyMERIC Cost of Living IndexZillowIRS 2026 bracketsCMS Medicaretsp.gov
How it works

Three steps to a clear answer

No spreadsheets and no sales calls. You enter your numbers and get your results right away.

01

Enter your numbers

Five quick steps: profile, location, assets, income and assumptions. Your entries save to your own browser as you type.

02

Explore your results live

Hover the map, try different destinations, change any figure, and watch your gap, readiness score and Monte Carlo update.

03

Download your report

Generate a structured 11-page PDF plan built from your inputs and the numbers computed for you.

Inside the assessment

Everything you need to decide where and when

All screenshots come from the real product. The figures belong to a fictional example person, "Alex Rivera".

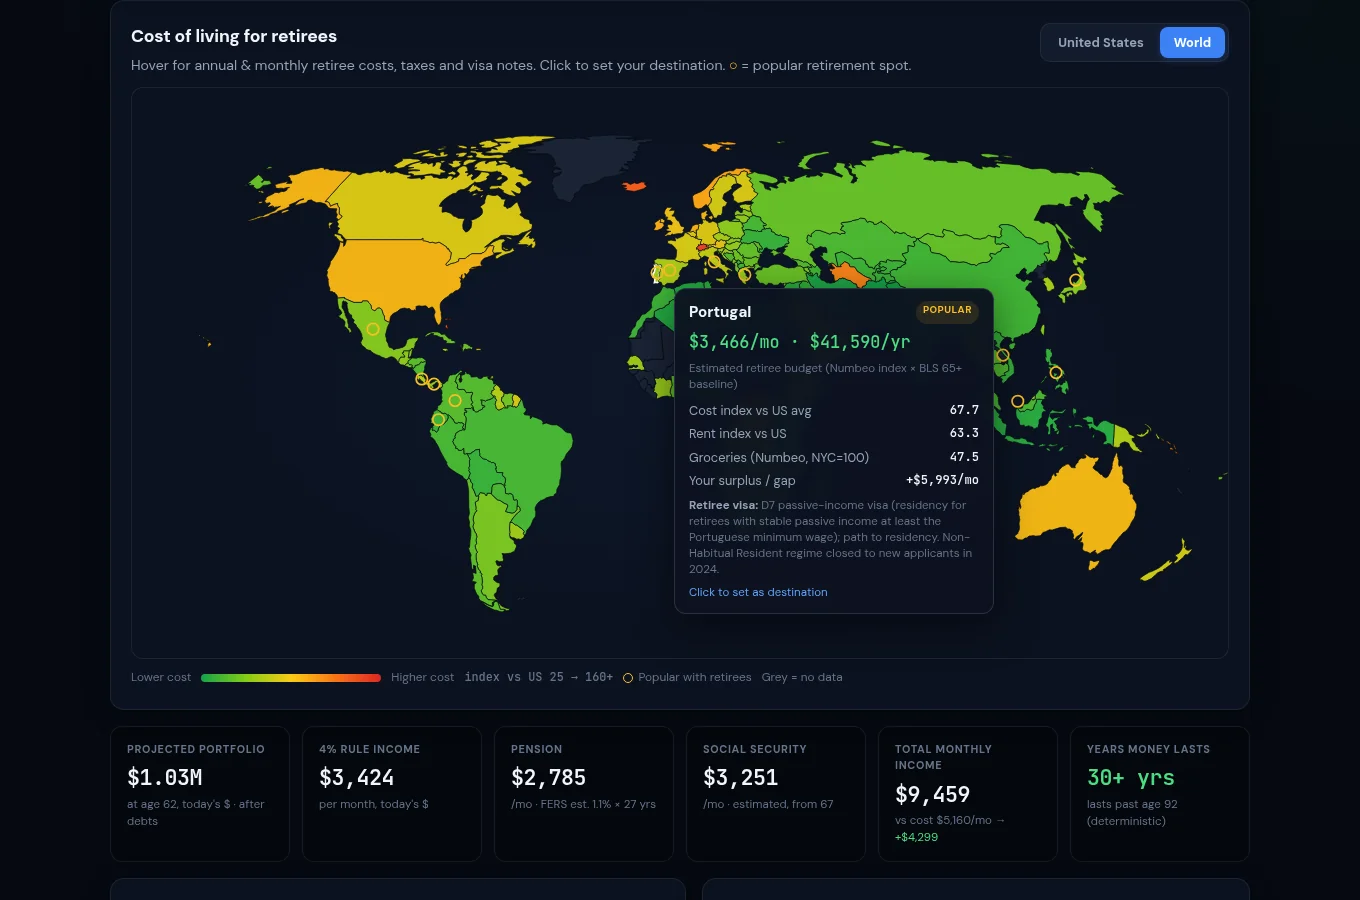
Cost-of-living map

Every state and 130+ countries, with data on hover

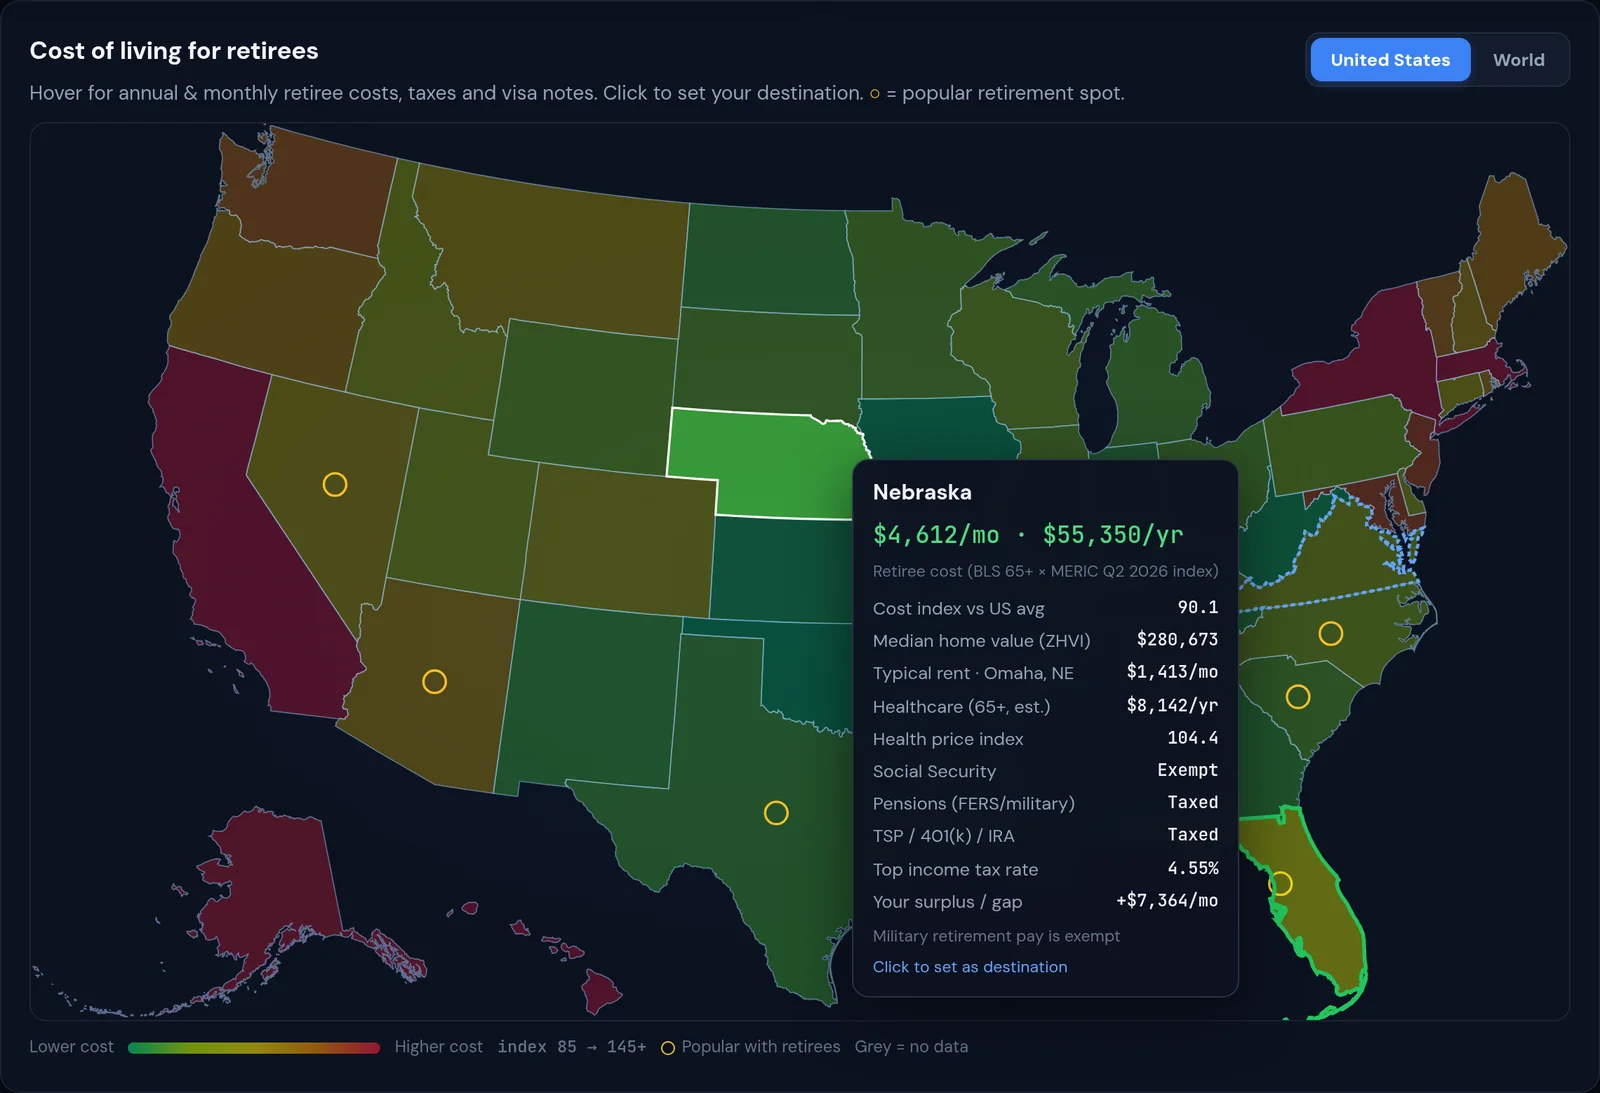
Switch between U.S. and world views. Hover any location to see monthly and annual retiree costs, housing, healthcare, state tax treatment of your TSP, pension and Social Security, and your projected surplus or gap there.

  • Color-coded from lower to higher cost
  • Popular retirement spots highlighted
  • Click a location to set it as your destination
Cost of living for retirees · United States
U.S. cost-of-living map with a hover tooltip showing retiree costs and taxes
World cost-of-living map
U.S. view with tooltip, plus the world view · example data
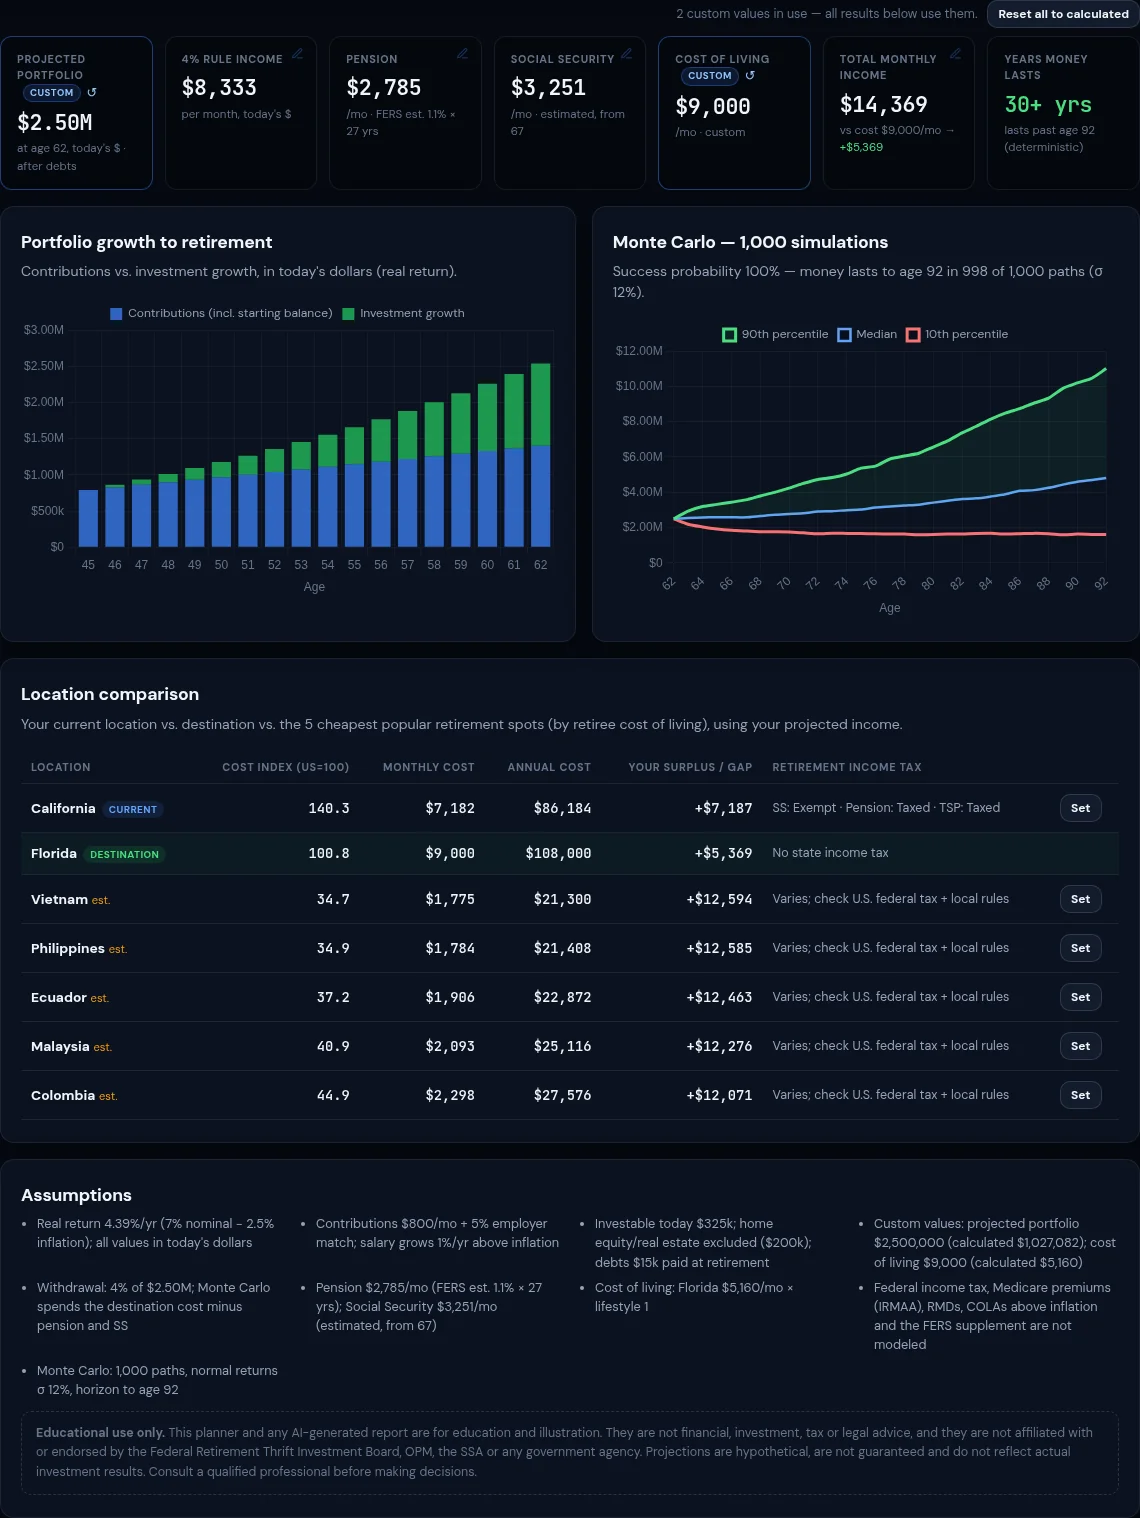
Live dashboard

Results that update as you change things

See your monthly surplus or gap at your destination, portfolio at retirement, readiness score and income stack. Every key number is an editable bubble, so you can enter your actual pension or Social Security figure and everything recalculates.

  • Monthly income compared with destination cost
  • Override any figure, then reset it with one click
  • Current location and destination side by side
Your results · editable
Results dashboard with editable figure bubbles
Example data
Monte Carlo

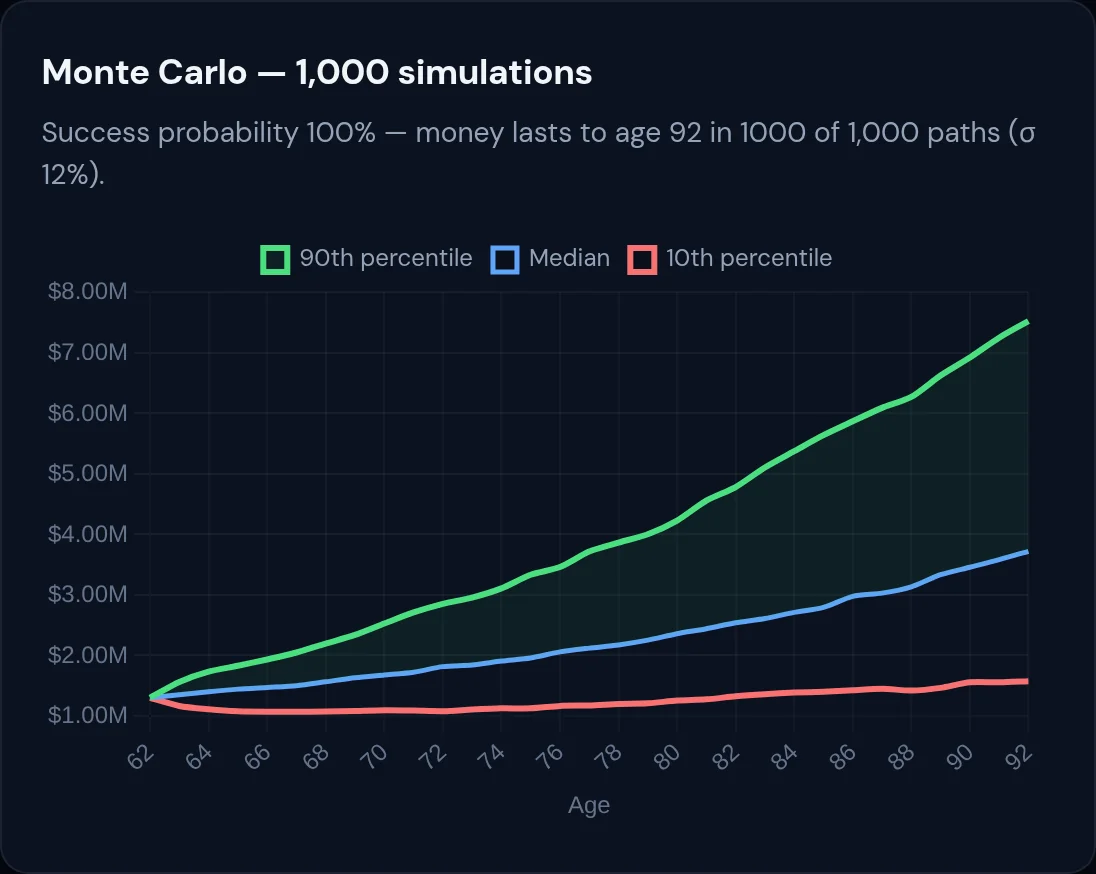
1,000 simulated markets, not one straight line

Your portfolio runs through 1,000 paths of randomized annual returns. Volatility is set by your risk tolerance, and each year it covers the gap between your destination's cost of living and your guaranteed income.

  • 10th, median and 90th percentile balances
  • Success rate is the share of paths where your money lasts to your life expectancy
  • Conservative, moderate or aggressive volatility
Monte Carlo · 1,000 simulations
Monte Carlo chart of 1,000 simulations showing percentile bands
Example data
Social Security timing

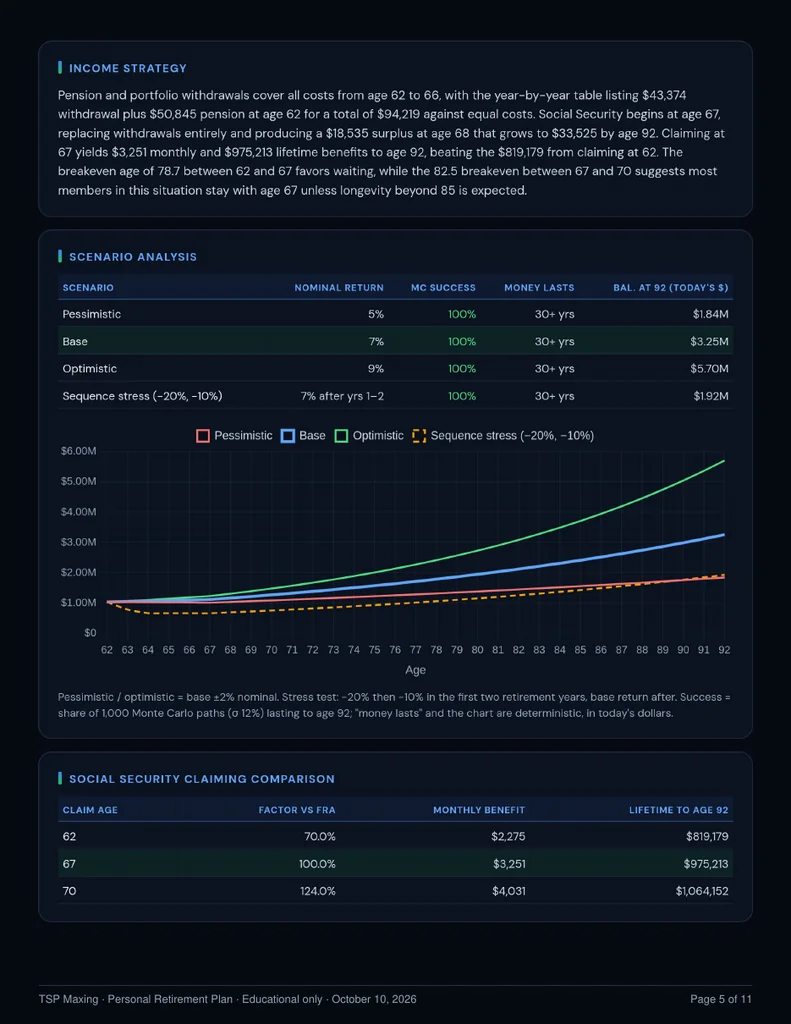
Claiming at 62, 67 or 70, side by side

Your report compares claiming ages so you can see how timing changes your monthly benefit and lifetime income. If you leave Social Security blank, it estimates your benefit with the SSA 2026 PIA formula. You can always enter the figure from your SSA statement.

  • Monthly benefit at each claiming age
  • How the choice affects your overall plan
Report page with income strategy, scenarios and Social Security claiming comparison
Report page 5 · example data
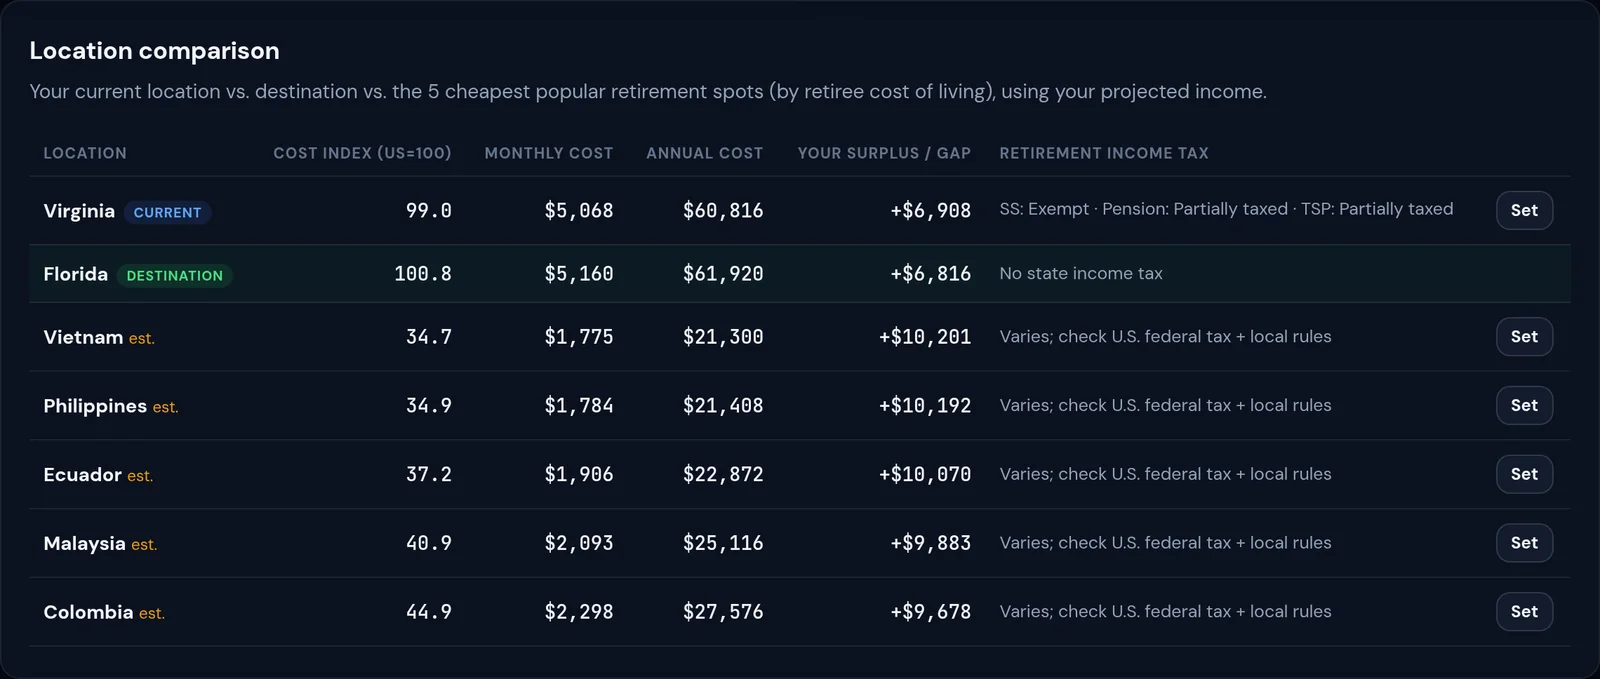
Location comparison

Your current home, your destination and the alternatives

A comparison table puts your current location next to your destination and the cheapest popular retirement spots. It shows the cost index, monthly and annual cost, your surplus or gap, and how each one taxes retirement income.

  • Lower-cost U.S. and international options
  • State tax treatment of Social Security, pensions and TSP
  • Set any row as your destination in one click
Location comparison
Location comparison table
Example data
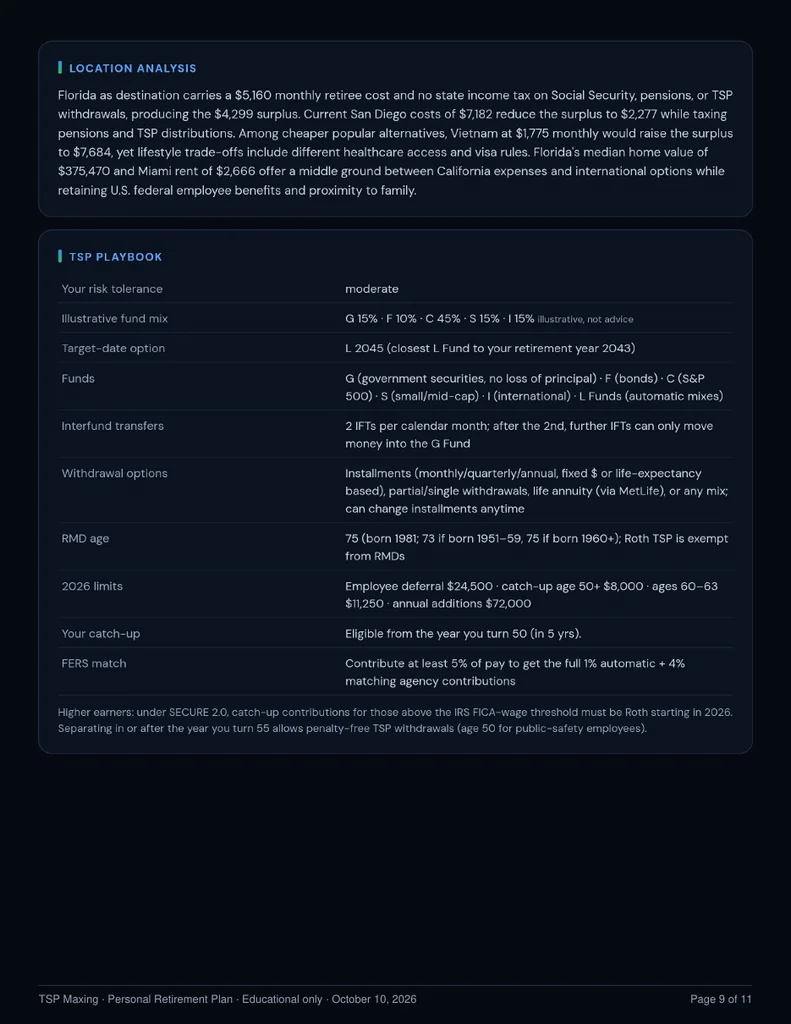
TSP playbook

A TSP playbook for your timeline

The report includes a TSP section covering fund allocation, contributions and capturing your match, along with withdrawal sequencing and tax considerations for your situation.

  • G, F, C, S, I and L fund context
  • Withdrawal sequencing and tax strategy
  • A 12-month action plan
Report page with location analysis and TSP playbook
Report page 9 · example data
AI-written PDF report

An 11-page personal retirement plan

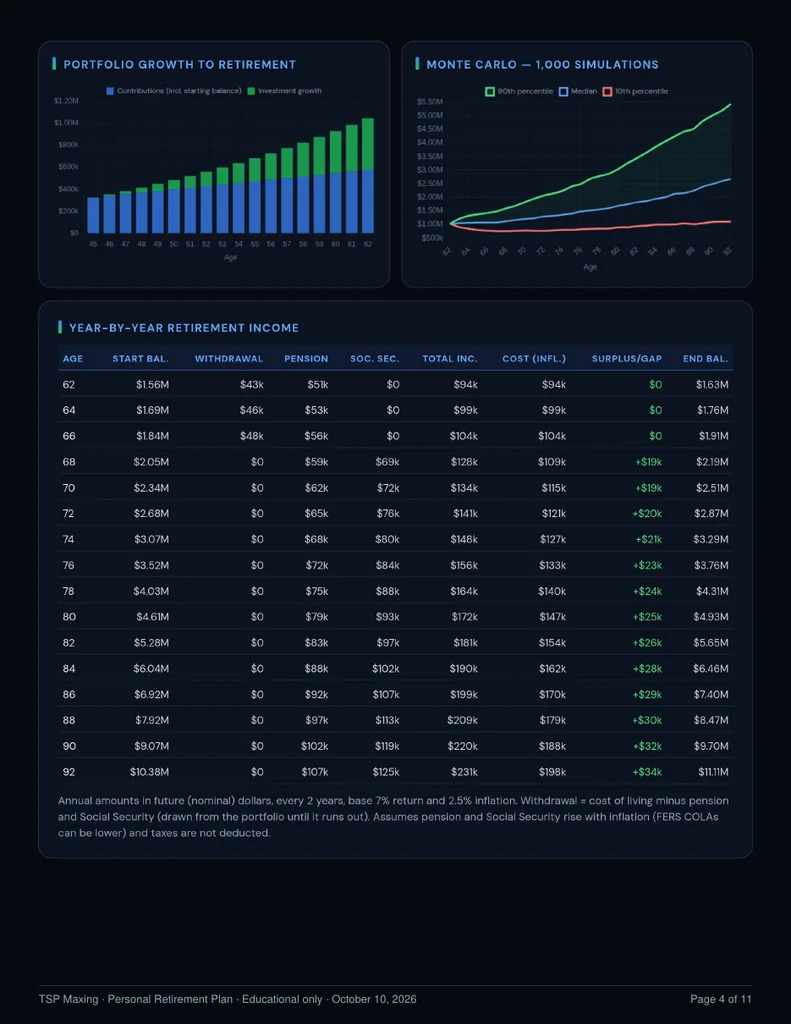
Generate a structured, professional report from your inputs and the numbers computed for you. It covers readiness score drivers, year-by-year income, scenarios and stress tests, Social Security, taxes, Medicare, location comparison, a TSP playbook and a 12-month action plan.

  • Generated on demand when you request it
  • Download and keep the PDF
  • Includes questions to ask a CFP
Report page 4
Report cover page
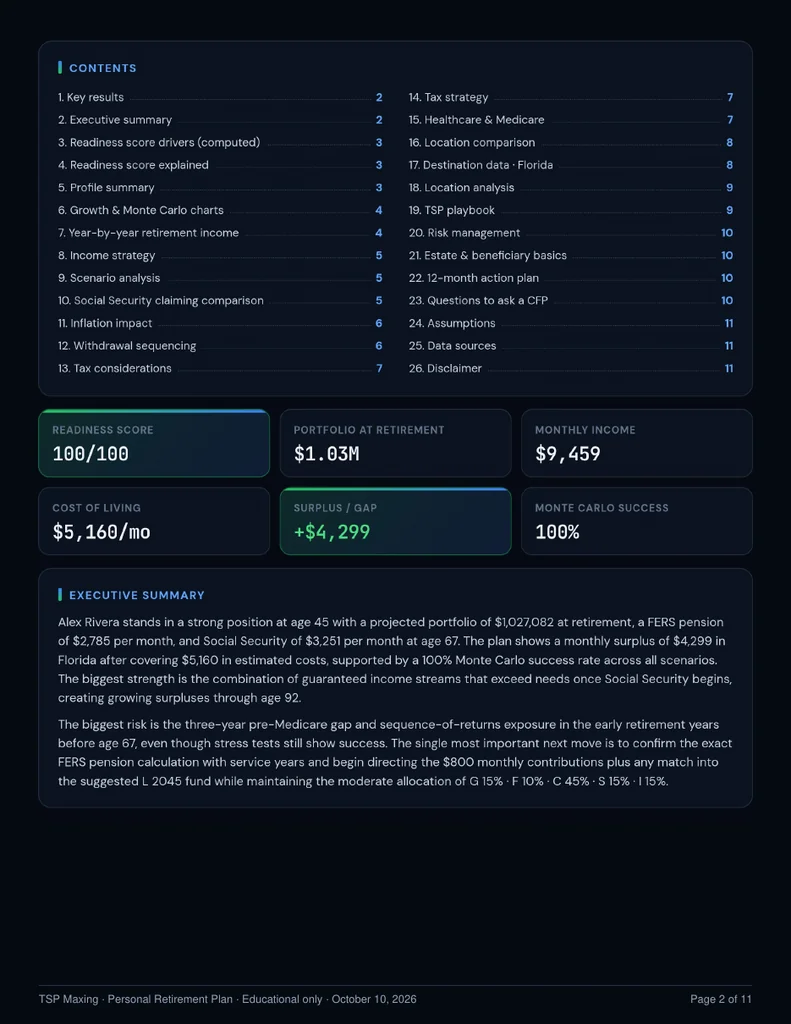
Report contents and executive summary
Sample report for a fictional person
What's in your report

26 sections across 11 pages

Every section is built from your own inputs and calculations.

01Key results & executive summary
02Readiness score drivers
03Profile summary
04Growth & Monte Carlo charts
05Year-by-year retirement income
06Income strategy & scenarios
07Social Security claiming comparison
08Inflation impact
09Withdrawal sequencing
10Tax considerations & strategy
11Healthcare & Medicare
12Location comparison & destination data
13TSP playbook
14Risk management
15Estate & beneficiary basics
1612-month action plan, questions for a CFP, assumptions & sources
Report page 1
Report page 2
Report page 4
Report page 5
Report page 9
Pages from a sample report for a fictional example person
Who it's for

Built for people with a TSP and a plan to retire

🏛️

Federal employees

FERS annuity estimates based on years of service and high-3, combined with your TSP and Social Security.

🎖️

Military

Military retired pay plus TSP, with state tax treatment of military pensions everywhere you're considering.

📈

TSP investors

See how your contributions, match and fund mix turn into retirement income.

🌎

Anyone planning to retire

Private-sector and self-employed savers can use their 401(k), IRA and brokerage accounts too.

Pricing

One simple price, or free with Consultation

INCLUDES ASSESSMENT FREE

Consultation plan

$40/mo

The full TSP Maxing membership, with the Retirement Assessment included.

  • Retirement Assessment included at no extra cost
  • Consultation access and tools
  • Everything in TSP Maxing membership
See the Consultation plan
FAQ

Questions, answered

Is this financial advice?

No. The Retirement Assessment is an educational planning tool. It shows estimates based on your inputs and public data. It isn't personalized financial, tax or legal advice, so please check important decisions with a qualified professional.

Where does the data come from?

Cost-of-living figures come from the BLS Consumer Expenditure Survey, the MERIC Cost of Living Index and Zillow housing data. Taxes use IRS 2026 brackets, healthcare uses CMS Medicare figures, and TSP details come from tsp.gov. The full list of sources and assumptions is shown in the tool and in your report.

How long does it take?

The form has five short steps, and most people can finish them in a single sitting. Your results update immediately, and the PDF report is generated when you request it.

What happens to my data?

Your inputs stay in your browser and are saved to its local storage. The PDF report is generated on demand, only when you ask for one.

Can I get a refund?

If you have a question about your purchase, please contact us and we'll help.

I'm on the Consultation plan. Do I need to buy this?

No. The Retirement Assessment is included free with the $40/mo Consultation plan.

Find out where your retirement can go furthest.

Your TSP, pension and Social Security compared against real cost-of-living data, plus a personal plan you can keep.