The Accuracy chart puts each strategy's real 2026 path next to what its own 23-year history projected, and next to the C, S, I and G Funds and the Nasdaq, S&P 500 and Dow. The bold line changes color with the fund held each day, so you can see exactly which moves made the difference.
Cancel anytime in one click: Manage or cancel subscription

Every number comes from official daily TSP share prices. As of the Oct 20, 2026 close.
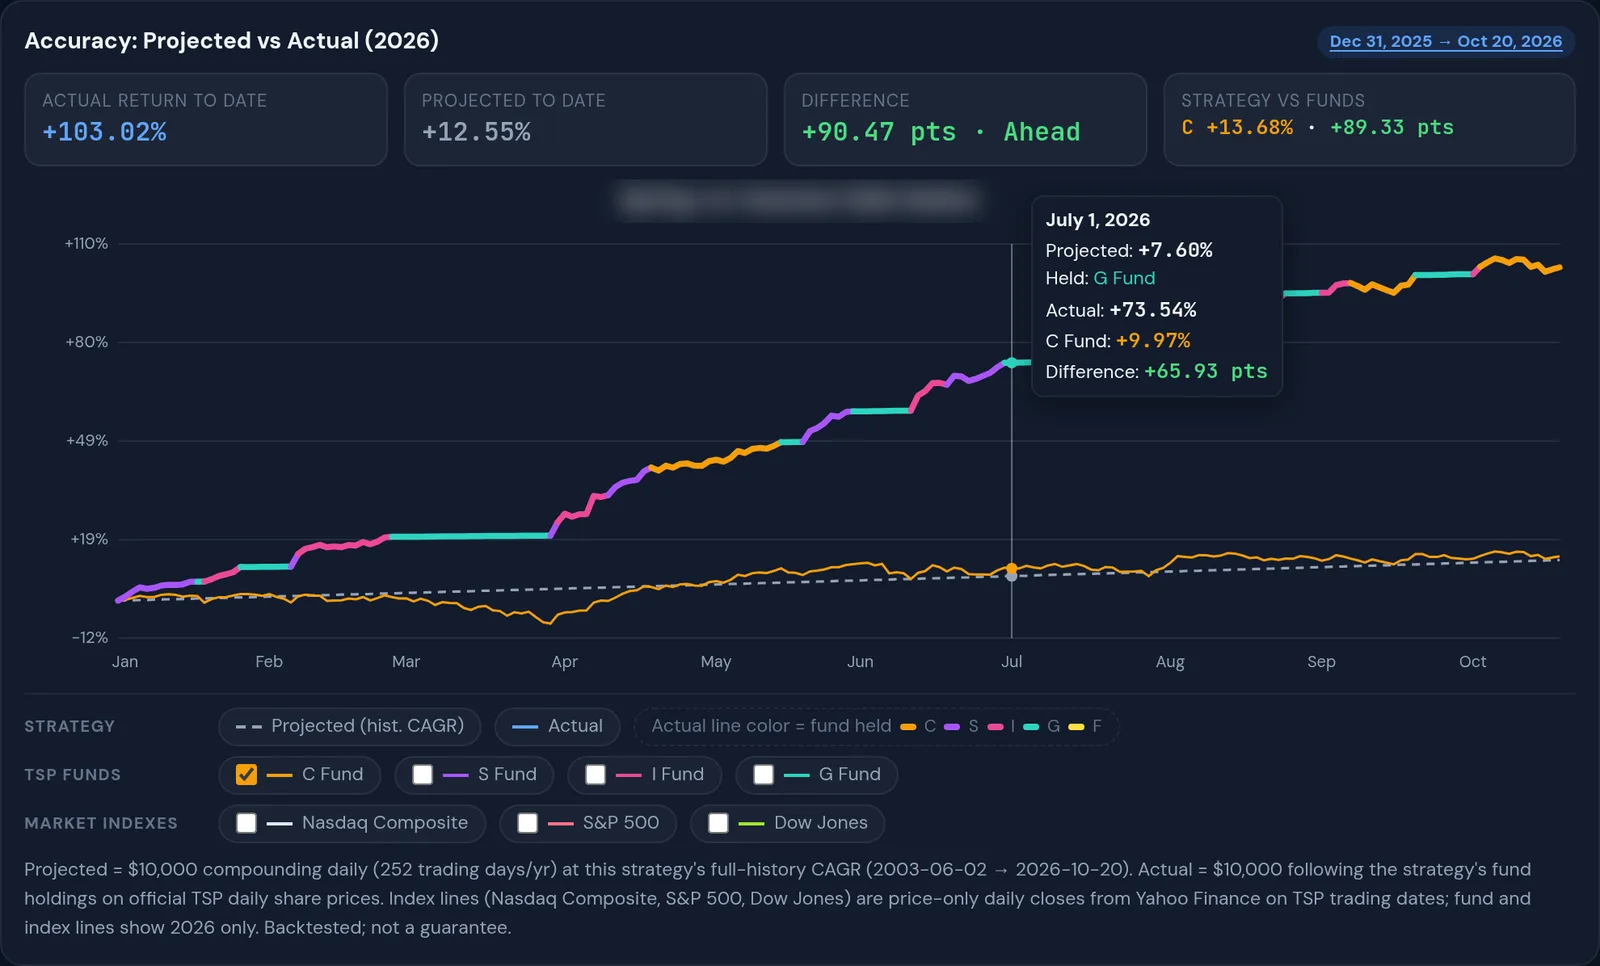
The dashed line compounds the strategy's full-history CAGR (2003–2026) day by day. The bold line is what it really did in 2026. A callout shows the gap in points, ahead or behind.
The Actual line turns orange in C, purple in S, pink in I, teal in G and yellow in F, and changes color on the exact transfer dates. Hover any day to see the fund held.
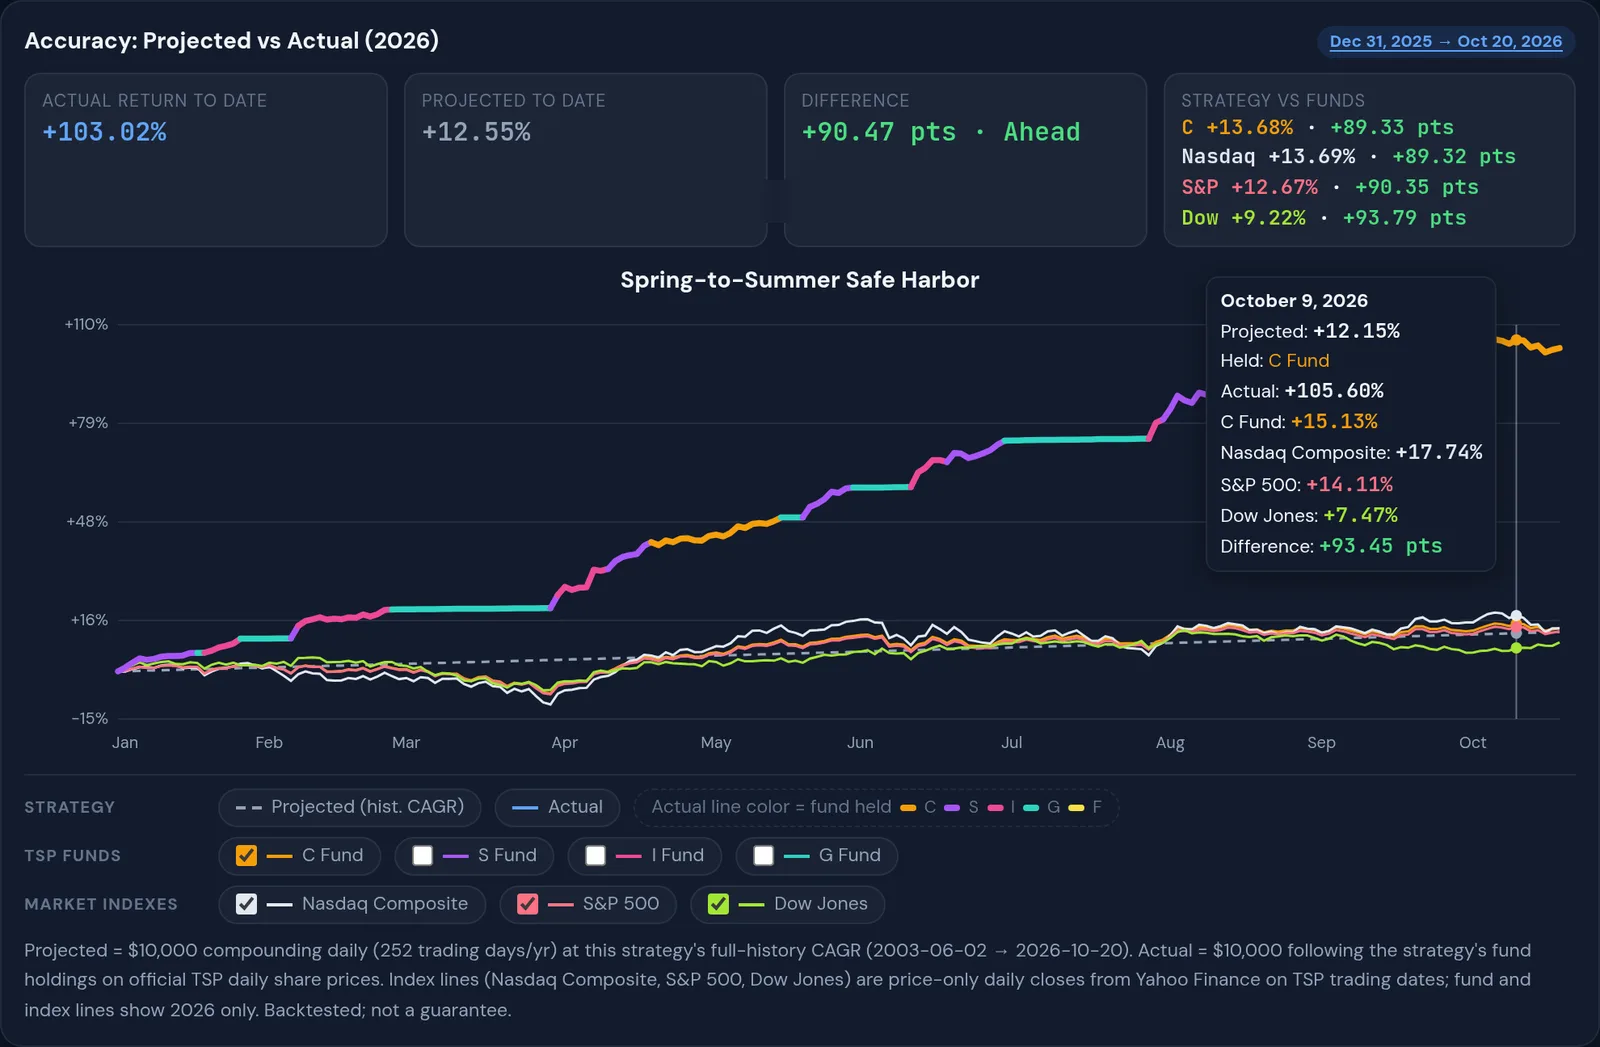
Toggle the C, S, I and G Funds plus the Nasdaq Composite, S&P 500 and Dow Jones. A box shows how far ahead or behind each one the strategy is.
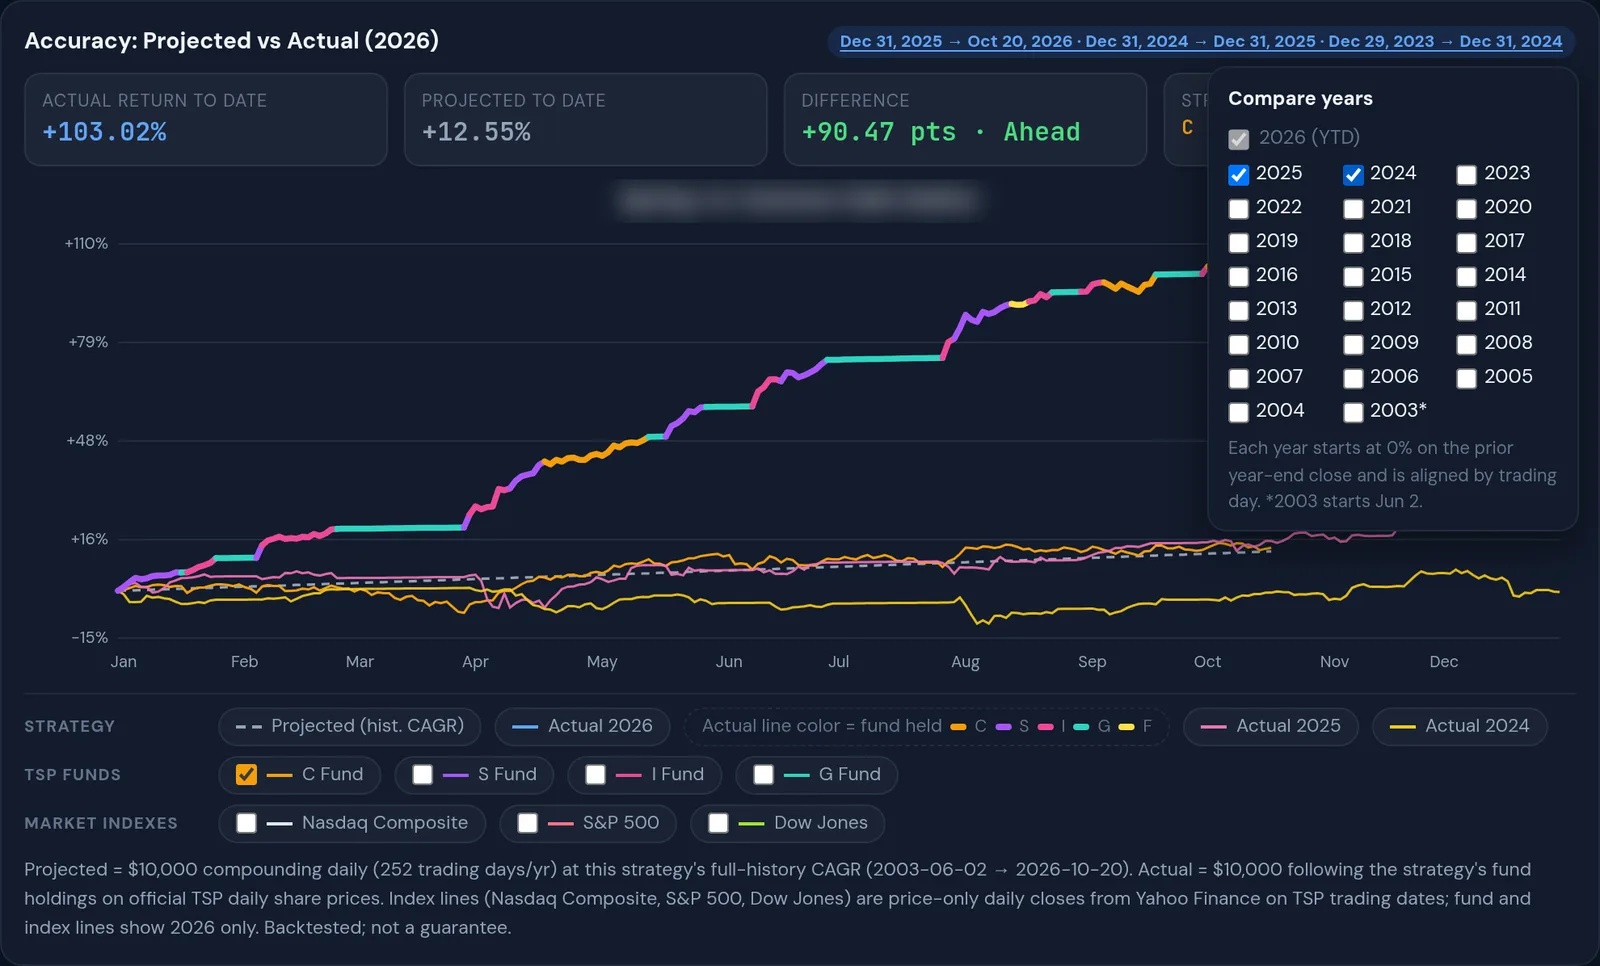
Click the date label to add any year back to 2003. Each year starts at 0% and lines up by trading day, so you can compare this year with last year and beyond.
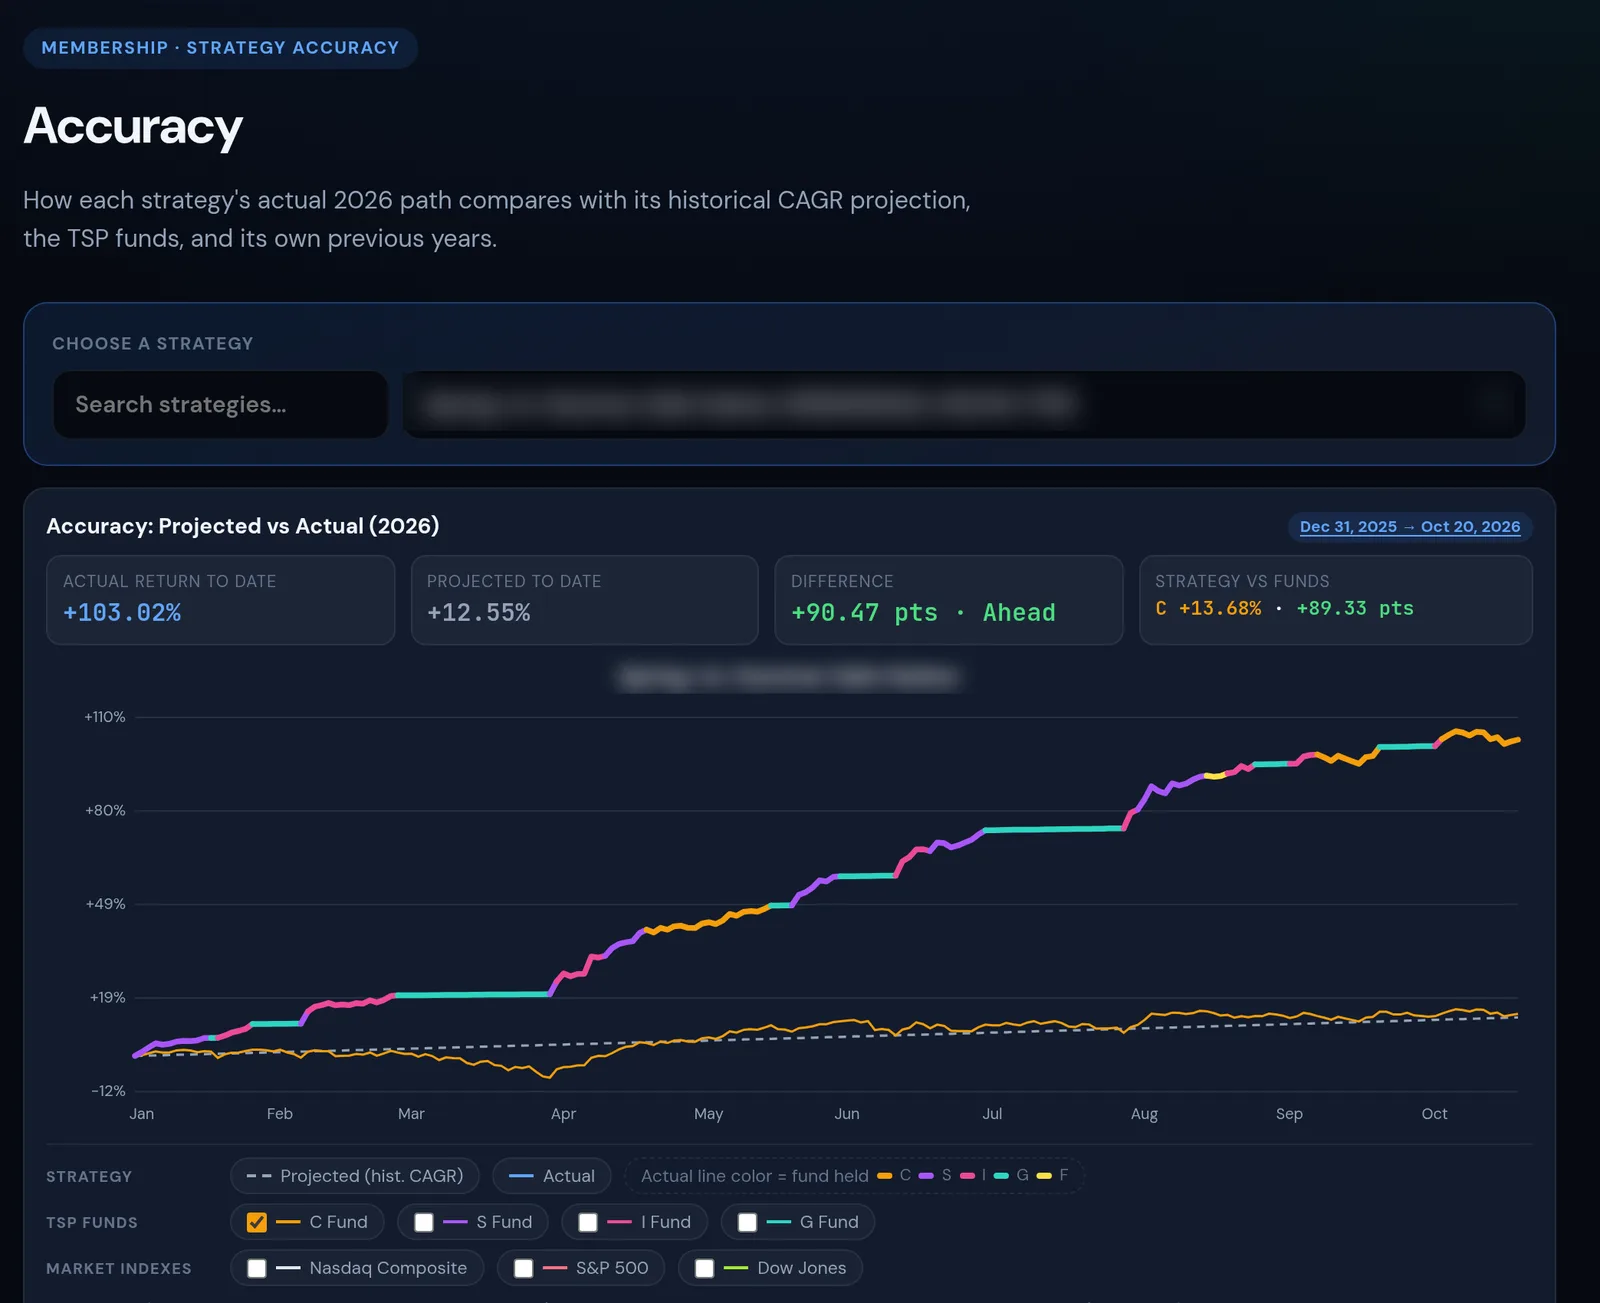
Taken from /app on Oct 21, 2026. Strategy names are blurred for non-members.
Open the Accuracy tab and pick any strategy from a searchable list, or scroll to the chart under a strategy's transfer calendar. Each chart is titled with the strategy it shows.

Turn on the funds and indexes you care about. In 2026 through Oct 20, strategy 26100024 returned +103.02% while the C Fund returned +13.68%, the S&P 500 +12.67%, the Nasdaq Composite +13.69% and the Dow +9.22%.

Add past years to overlay each one's actual path. For strategy 26100024, 2025 finished at +26.70% and 2024 at −0.41%. The chart shows the good years and the bad ones.

Dec 31, 2025 close to Oct 20, 2026 close, official daily TSP share prices. Backtested results, not actual account returns.
Following the strategy's fund holdings with 26 transfers, each inside the 2-IFT monthly limit.
Its full-history CAGR of 16.06% (2003–2026), compounded over the same trading days.
The gap the chart's callout shows for this strategy.
C Fund buy-and-hold returned +13.68% over the same period.
As of Oct 20, 2026. Backtested results from historical data. Past performance doesn't guarantee future results.
Check a strategy's real-world record before you trust it with your TSP.
See at a glance how a strategy is tracking, even between deployments and moves.
Compare against simply holding C, S, I or G, or the major indexes.
Look past one good year and see how a strategy did across 2003–2026.
Both plans unlock the full members area, including the Accuracy tab. Cancel anytime through Stripe.
TSP Maxing tools membership.
The full membership, billed once a year.
Cancel anytime in one click: Manage or cancel subscription
Strategy, projection and fund lines use official daily TSP share prices. Index lines use price-only daily closes for the Nasdaq Composite, S&P 500 and Dow Jones on TSP trading days.
It compounds the strategy's full-history CAGR (June 2003 to October 2026) daily, at 252 trading days a year, from the Dec 31, 2025 close.
Not necessarily. All figures are backtested results on historical prices. Past performance doesn't guarantee future results.
No. TSP Maxing is educational research. It isn't personalized investment, tax or legal advice and isn't official TSP guidance.
Yes. Monthly and Annual are Stripe subscriptions, and you can cancel anytime through Stripe.
See projected vs. actual for every strategy. Join for $19/mo, or get the best value at $149/yr.
Cancel anytime in one click: Manage or cancel subscription