New for members · Allocation tab

Know exactly what's inside your TSP funds.

The Allocation tab opens each TSP fund (C, S, I, G and F) with one switcher. See the top holdings and their weights, sector and country breakdowns, fees, fund size and the closest low-cost funds outside the TSP. It also covers how the G Fund rate is set and what's in the F Fund's bonds.

Cancel anytime in one click: Manage or cancel subscription

Sourced from tsp.govProxies clearly labeledCancel anytime
tspmaxing.com/app · Allocation
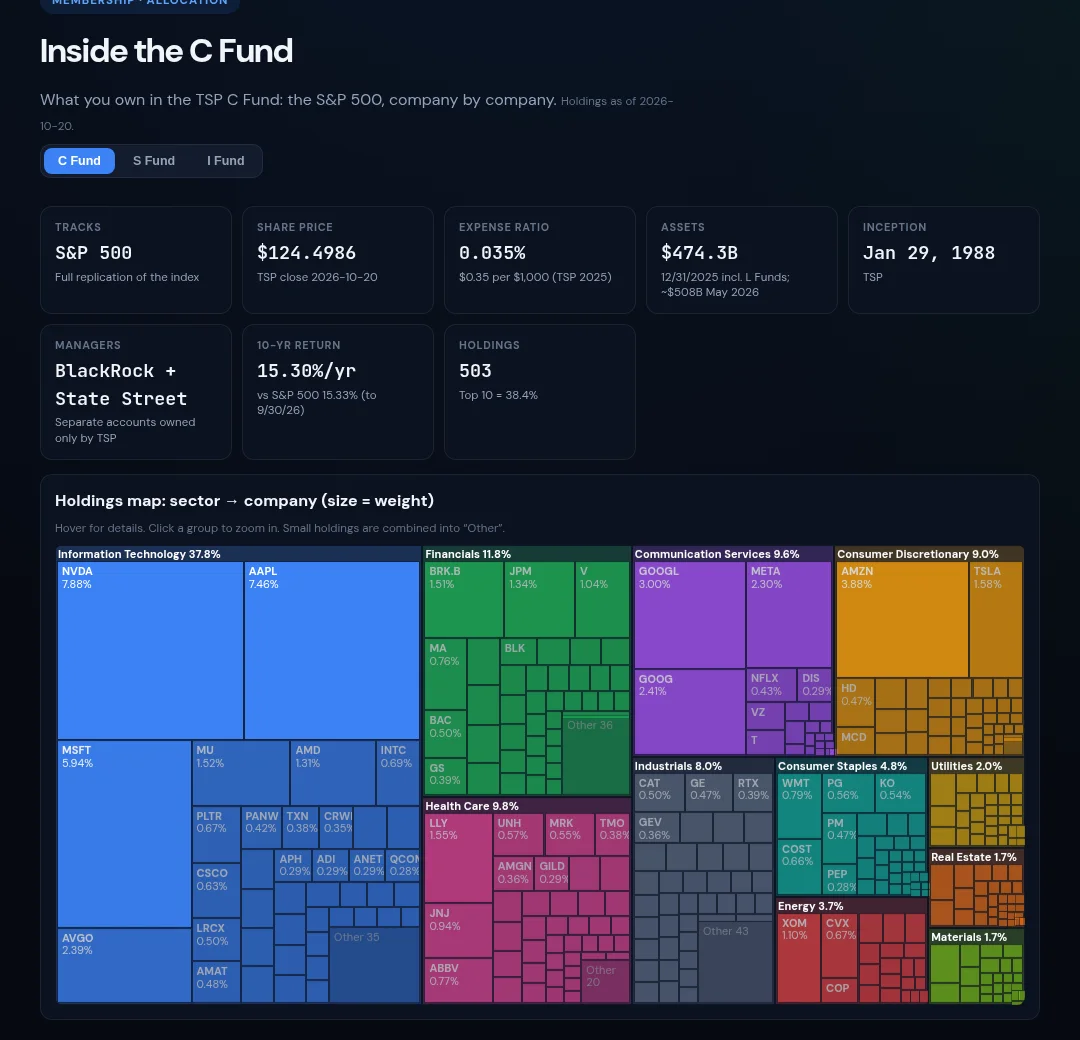
TSP Maxing Allocation tab: inside the C Fund with key facts and a sector-by-company holdings map
C Fund · total expense ratio (2025)
0.035%
C Fund · top 10 share (proxy)
38.39%
In the tab C · S · I · G · FHoldingsSectorsCountriesFeesLookalike fundsG rateBond mix
What it shows

Five funds, one switcher

Fund facts come from tsp.gov. Where the TSP doesn't publish daily holdings, the tab uses a public index fund as a proxy, and says so.

C

S&P 500, company by company

A sector → company holdings map, the top 10 and a searchable list of all 503 holdings. Weights come from SPY daily holdings as the S&P 500 proxy.

S

Everything outside the S&P 500

Mid, small and micro caps, mapped from 3,312 VXF holdings (proxy), with the official TSP sector weights next to them.

I

Countries, not just companies

Official TSP country weights for all 44 countries, index sectors and top holdings for the ex-China, ex-Hong Kong index.

G · F

Rate and bonds explained

How the G Fund rate is set, its monthly history and every debt-limit episode. For the F Fund, the bond mix, credit quality and duration (BND proxy).

Inside the members area

Real screenshots from the Allocation tab

Taken from /app. The full searchable holdings list is blurred for non-members.

C Fund

Top holdings, sectors and every stock

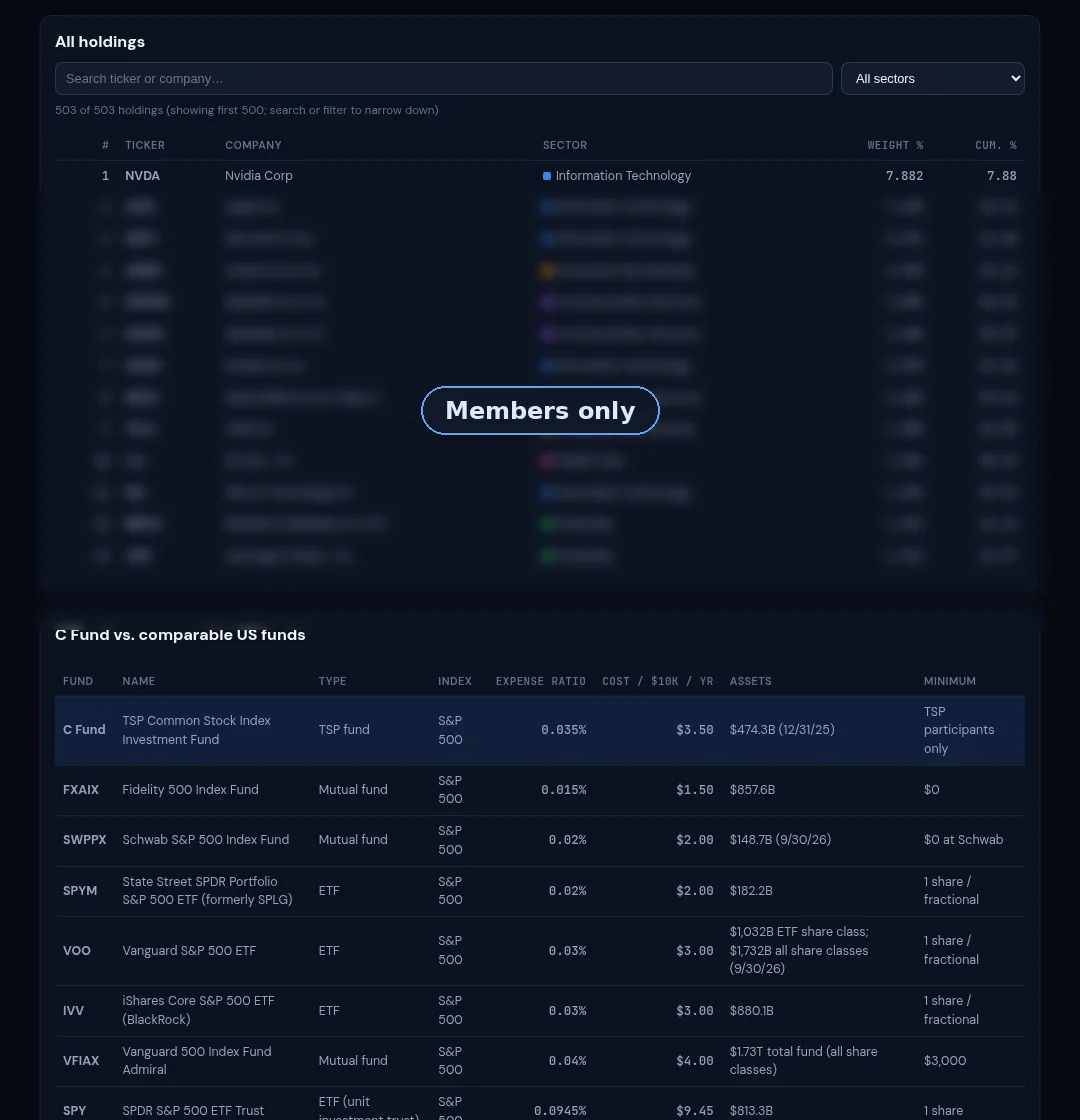
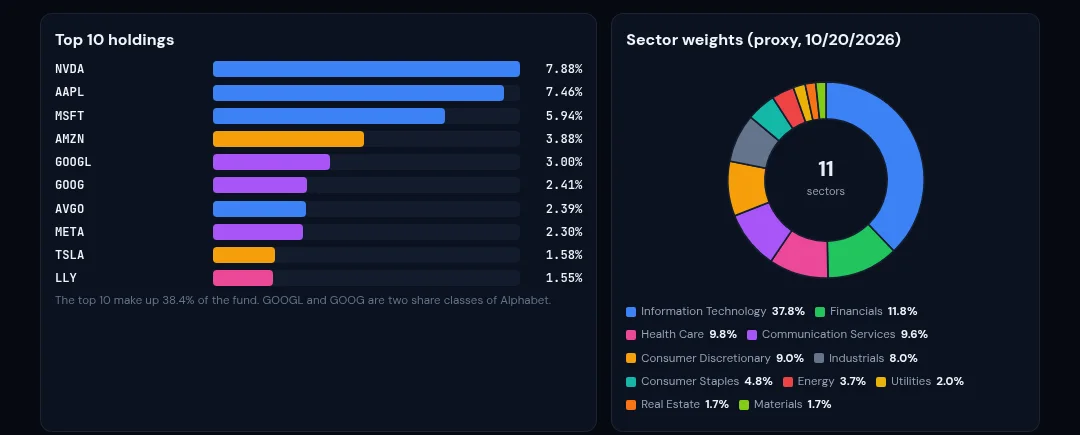
The C Fund holds all the stocks in the S&P 500 in virtually the same weights. Nvidia (7.88%), Apple (7.46%) and Microsoft (5.94%) lead the proxy weights, and the top 10 make up 38.39%.

  • Weights from SPY daily holdings (Oct 20, 2026), labeled as a proxy
  • Official TSP sector weights from Dec 31, 2025
  • Search and filter all holdings by sector
tspmaxing.com/app · Allocation · C Fund
C Fund top 10 holdings and sector weights donut (SPY proxy)
Fees & lookalikes

What it costs, and how it compares

The C Fund's total expense ratio for 2025 was 0.035%, or $0.35 per $1,000, on $474.3B of assets (Dec 31, 2025). The tab lines it up against FXAIX (0.015%), SWPPX (0.02%), VOO and IVV (0.03%), VFIAX and SPY.

  • Expense ratio, assets and minimums side by side
  • Same idea for every fund: FSMAX and VXF for S, VXUS and IXUS for I, AGG and FXNAX for F
  • Returns vs. index after expenses
tspmaxing.com/app · Allocation · C Fund
C Fund full holdings list (blurred for non-members) and comparison with low-cost S&P 500 funds
S Fund

The rest of the U.S. market

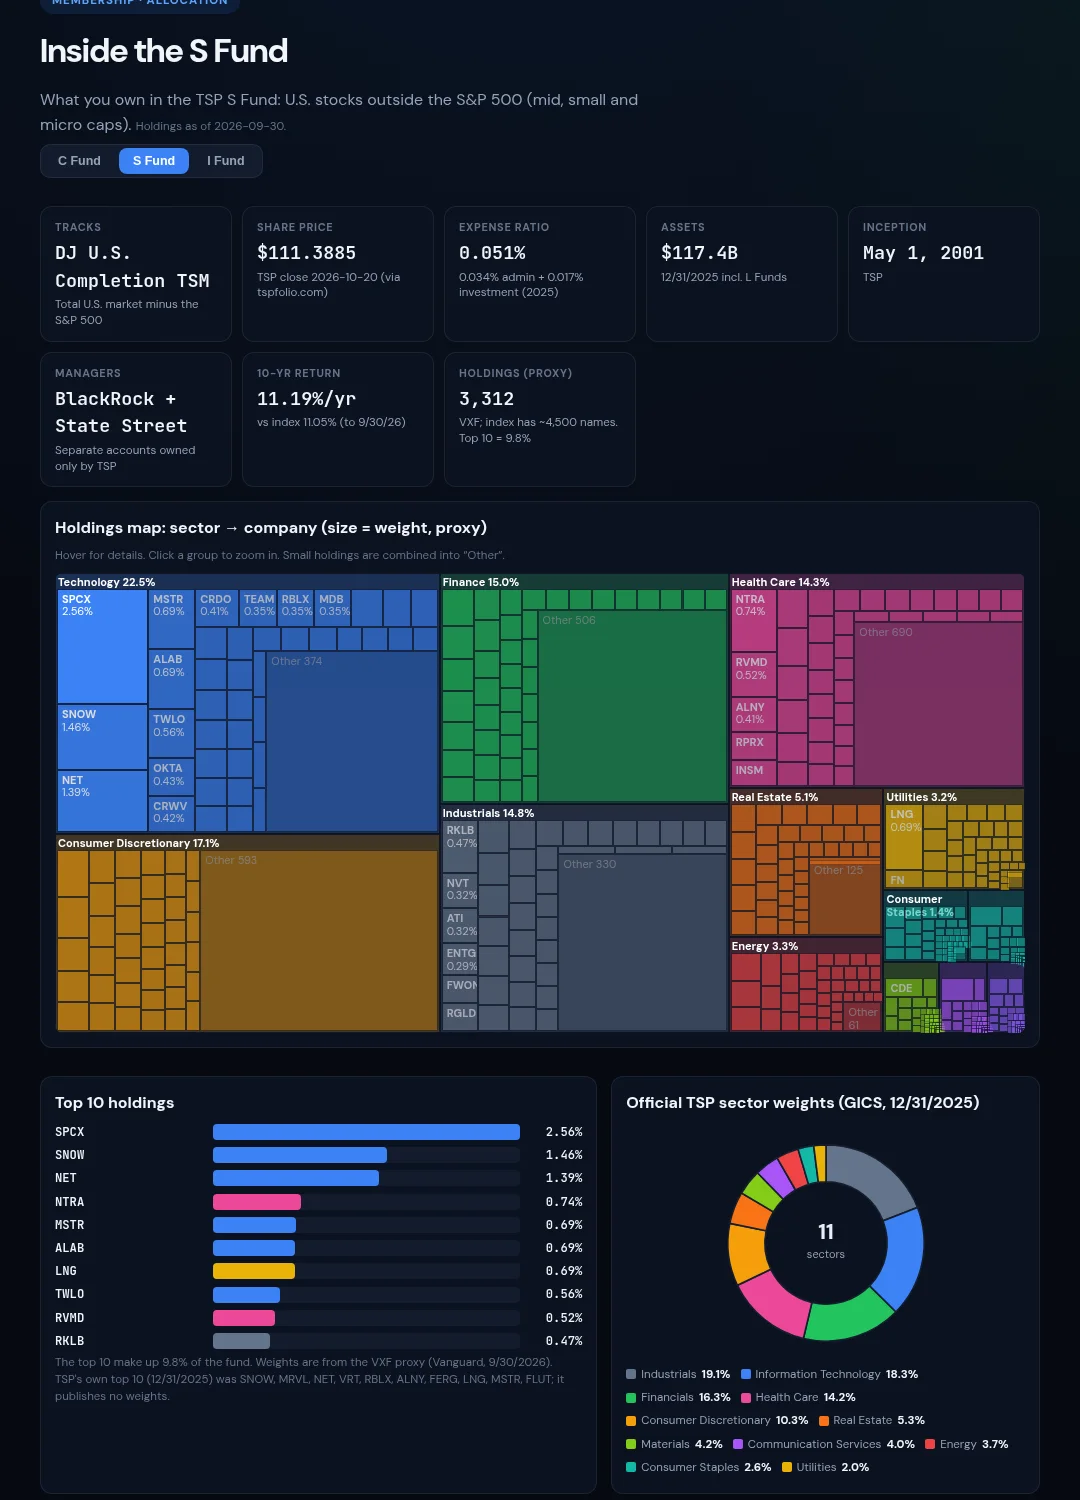
The S Fund tracks the Dow Jones U.S. Completion Total Stock Market Index, about 4,500 stocks outside the S&P 500. Its total expense ratio for 2025 was 0.051%, on $117.4B of assets. The holdings map uses VXF as a proxy, where the top 10 add up to only 9.8%.

  • Official TSP sectors: Industrials 19.1%, IT 18.3%, Financials 16.3%
  • TSP's own top 10 names listed (no weights published)
  • FSMAX is the exact index match at 0.034%
tspmaxing.com/app · Allocation · S Fund
S Fund facts, sector holdings map and top 10 holdings (VXF proxy)
I Fund

44 countries, ex China and Hong Kong

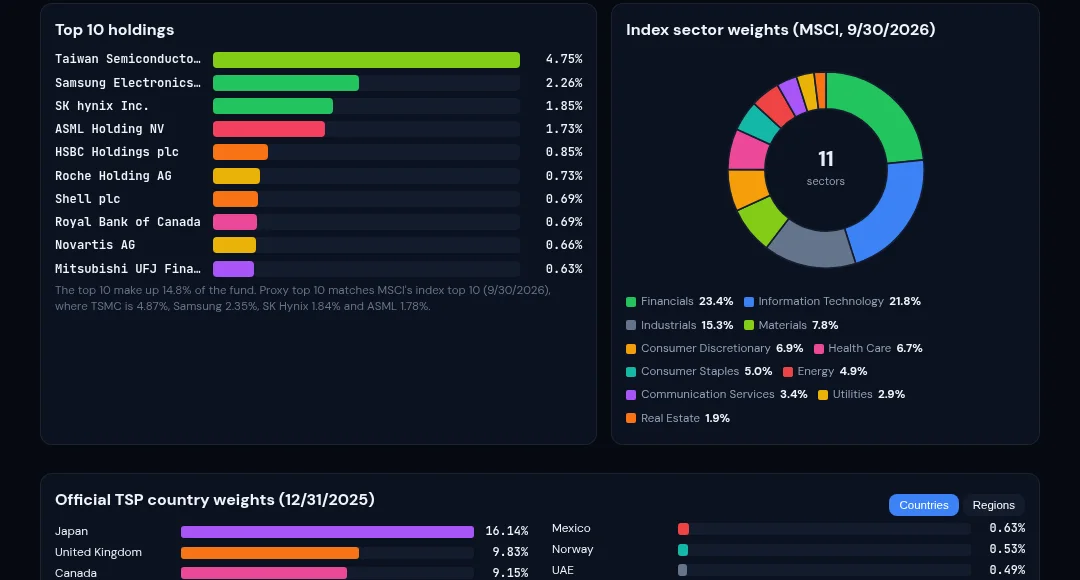
Since 2024 the I Fund has tracked the MSCI ACWI IMI ex USA ex China ex Hong Kong. Official TSP country weights (Dec 31, 2025) start with Japan at 16.14%, the UK at 9.83% and Canada at 9.15%. The top holdings are TSMC (4.87%), Samsung (2.35%) and SK Hynix (1.84%) in the MSCI index.

  • Country weights for all 44 countries
  • MSCI index sectors, Financials 23.35% first
  • 0.048% total expense ratio, $123.6B in assets
tspmaxing.com/app · Allocation · I Fund
I Fund top 10 holdings, index sector weights and official TSP country weights
G Fund

How the rate is set, and every debt-limit episode

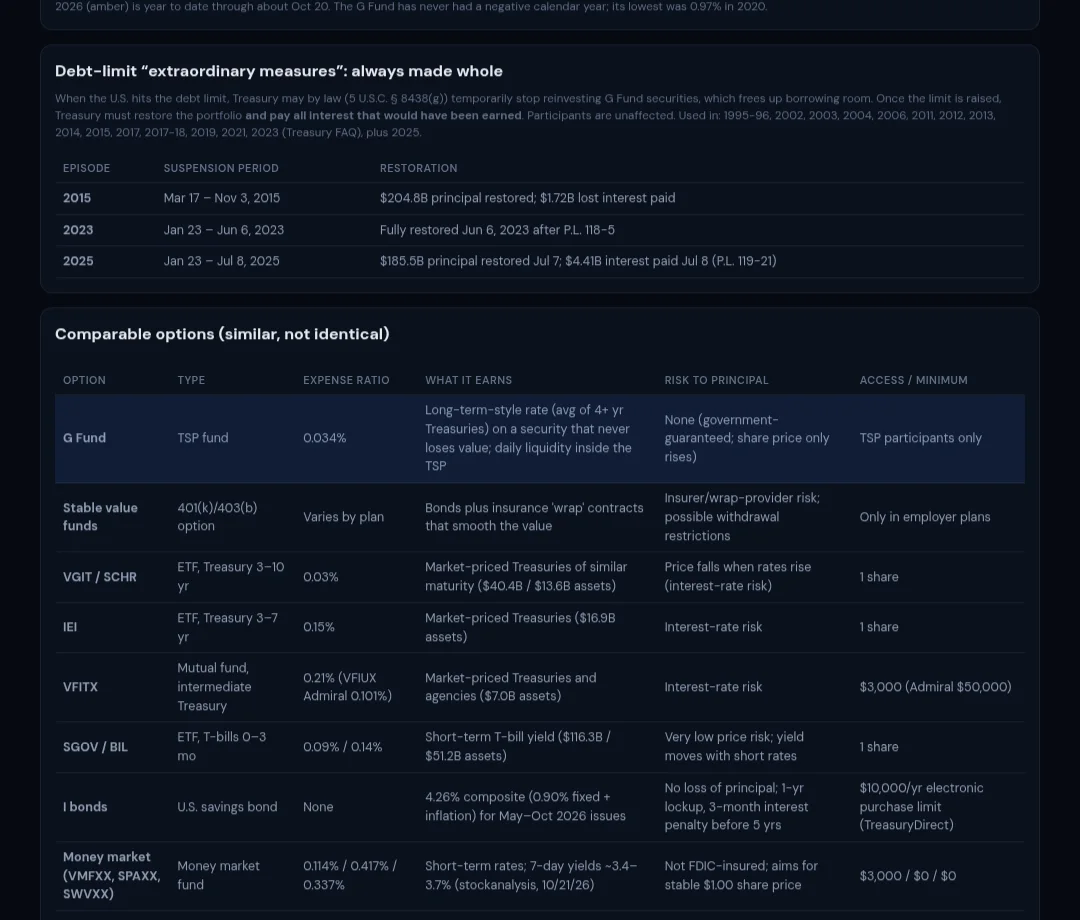
The G Fund holds special-issue Treasury securities that can't lose value. Its rate is the weighted average yield of Treasuries with four or more years to maturity, and it was 5.375% for October 2026. The tab charts the rate history and lists the debt-limit periods when Treasury suspended reinvestment, each of which was later made whole.

  • 2025: Jan 23 – Jul 8, $185.5B principal plus $4.41B interest restored
  • Calendar-year returns from 1988 (lowest: 0.97% in 2020)
  • Compared with stable-value funds, Treasury ETFs, money markets and I bonds
tspmaxing.com/app · Allocation · G Fund
G Fund debt-limit history and comparison with Treasury funds, money markets and I bonds
F Fund

Bond mix, credit quality and duration

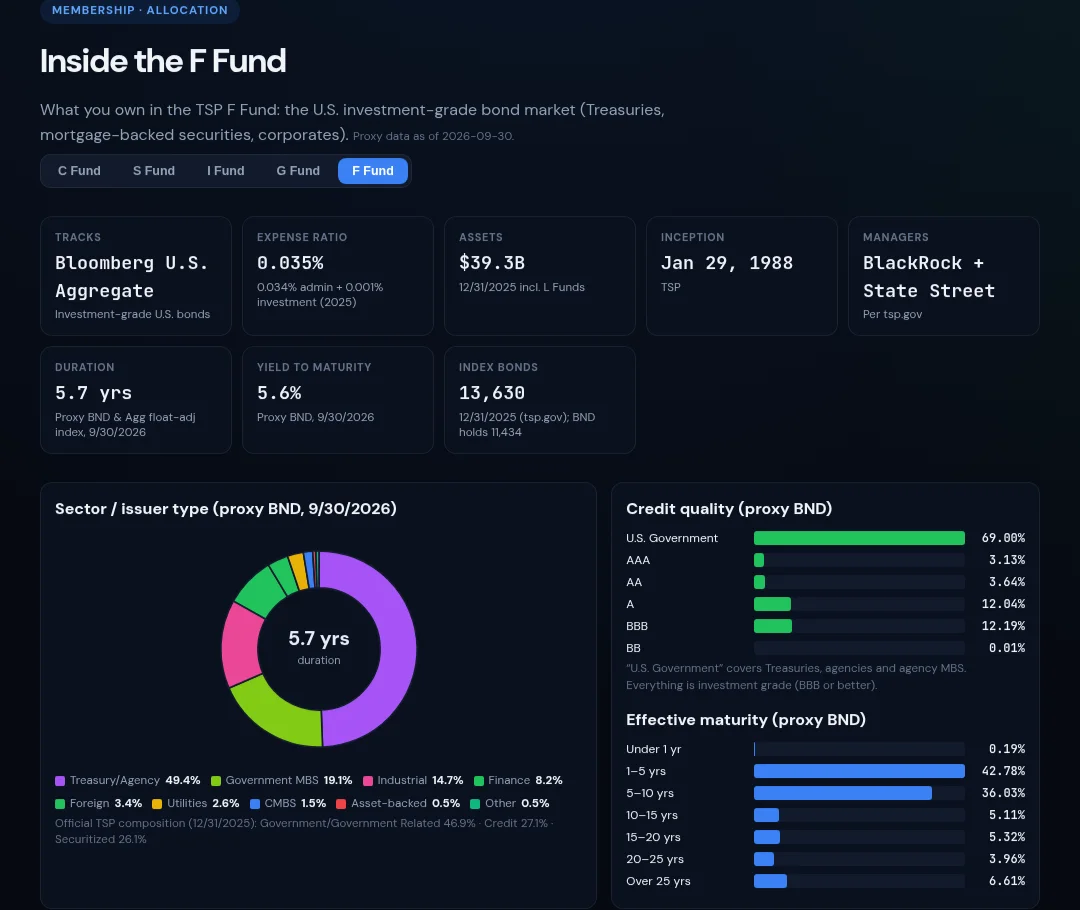
The F Fund tracks the Bloomberg U.S. Aggregate Bond Index (0.035% expense ratio, $39.3B). Using Vanguard BND as a proxy (Sep 30, 2026), the tab shows the issuer mix, a 5.7-year duration and credit quality: 69.0% U.S. government, 12.0% A, 12.2% BBB.

  • Issuers: U.S. Treasury 48.9%, Fannie Mae 7.7%, Freddie Mac 6.8%
  • Maturity: 42.8% in 1–5 years, 36.0% in 5–10
  • Calendar years back to 1988, worst was −12.83% in 2022
tspmaxing.com/app · Allocation · F Fund
F Fund facts, issuer donut, credit quality and maturity (BND proxy)
On your phone

Every fund, in your pocket

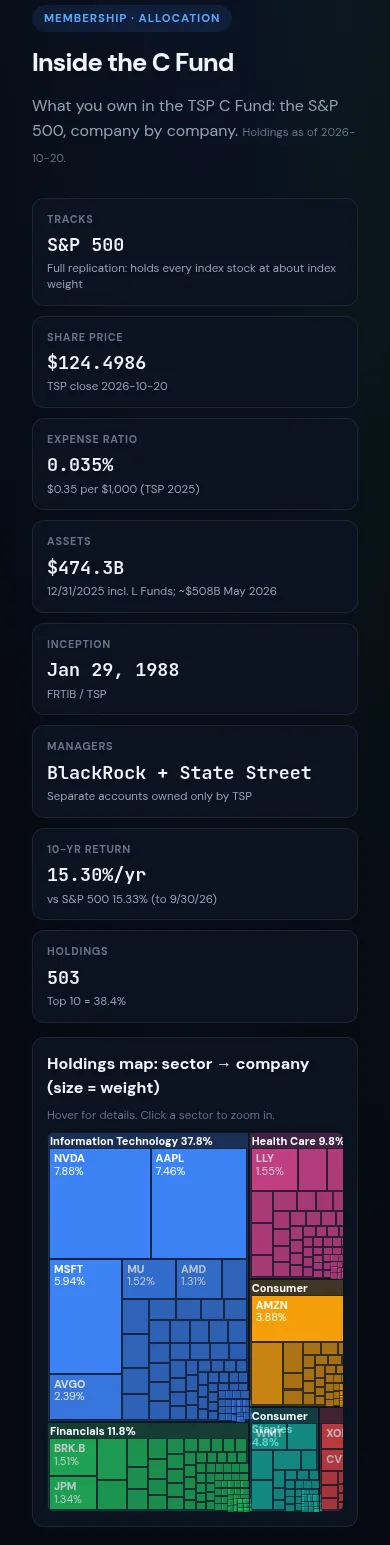
The Allocation tab works on mobile. Switch funds, tap into a sector, and check fees in seconds.

  • Same data as desktop
  • Tap to zoom the holdings map
  • No app to install
TSP Maxing Allocation tab on a phone, inside the C Fund
At a glance · from tsp.gov

The five TSP funds, side by side

Total expense ratios for 2025 and assets as of Dec 31, 2025. G Fund rate for October 2026.

0.035%

C Fund

S&P 500 · $474.3B in assets. 10-year return 15.30%/yr to Sep 30, 2026.

0.051%

S Fund

DJ U.S. Completion · $117.4B. 10-year return 11.19%/yr.

0.048%

I Fund

MSCI ACWI IMI ex USA ex China ex HK · $123.6B. 10-year return 10.06%/yr.

5.375%

G Fund rate

October 2026 rate · 0.034% expense ratio · $317.7B. The F Fund is 0.035% on $39.3B.

About the data. The TSP publishes only quarterly top-10 and sector data for its funds, so holdings maps use public index funds as clearly labeled proxies: SPY for C, VXF for S, VXUS for I and BND for F. Lookalike funds are similar, not identical. Returns are historical and don't guarantee future results.
Who it's for

Built for TSP participants

🏛️

Federal employees

Know what's really in the funds you hold before you rebalance.

🎖️

Military members

A clear picture of each fund, wherever you're stationed.

📊

Fee-conscious investors

Compare TSP costs with the cheapest index funds outside the plan.

🧭

Rollover planners

Find the closest lookalike fund if you ever move money to an IRA.

Pricing

The Allocation tab is included in membership

Both plans unlock the full members area, including the Allocation tab. Cancel anytime through Stripe.

Monthly

$19/mo

TSP Maxing tools membership.

  • Allocation tab for all five funds
  • Live signal and transfer dates
  • Strategies, prediction and analyzer suite
  • Cancel anytime
Start Monthly

Cancel anytime in one click: Manage or cancel subscription

FAQ

Questions, answered

Are these the TSP's exact holdings?

Fund facts, sector weights and I Fund country weights are the TSP's own published figures. The TSP doesn't publish full daily holdings, so company-level weights come from public index funds tracking the same or a similar index (SPY, VXF, VXUS, BND). Every proxy is labeled.

Where do the numbers come from?

tsp.gov fund pages and fee disclosures, official TSP share prices, MSCI index factsheets, Treasury's G Fund FAQ, and fund-provider and stockanalysis.com data for comparable funds. Each section shows its as-of date.

Should I move my money to a lookalike fund?

That's your call. TSP Maxing doesn't recommend specific funds. Lookalikes are shown for comparison only, and they're similar, not identical.

Is this investment advice?

No. TSP Maxing is educational research. It isn't personalized investment, tax or legal advice and isn't official TSP guidance.

Can I cancel?

Yes. Monthly and Annual are Stripe subscriptions, and you can cancel anytime through Stripe.

Know what you own.

Holdings, sectors, countries, fees and lookalikes for every TSP fund. Join for $19/mo, or get the best value at $149/yr.

Cancel anytime in one click: Manage or cancel subscription