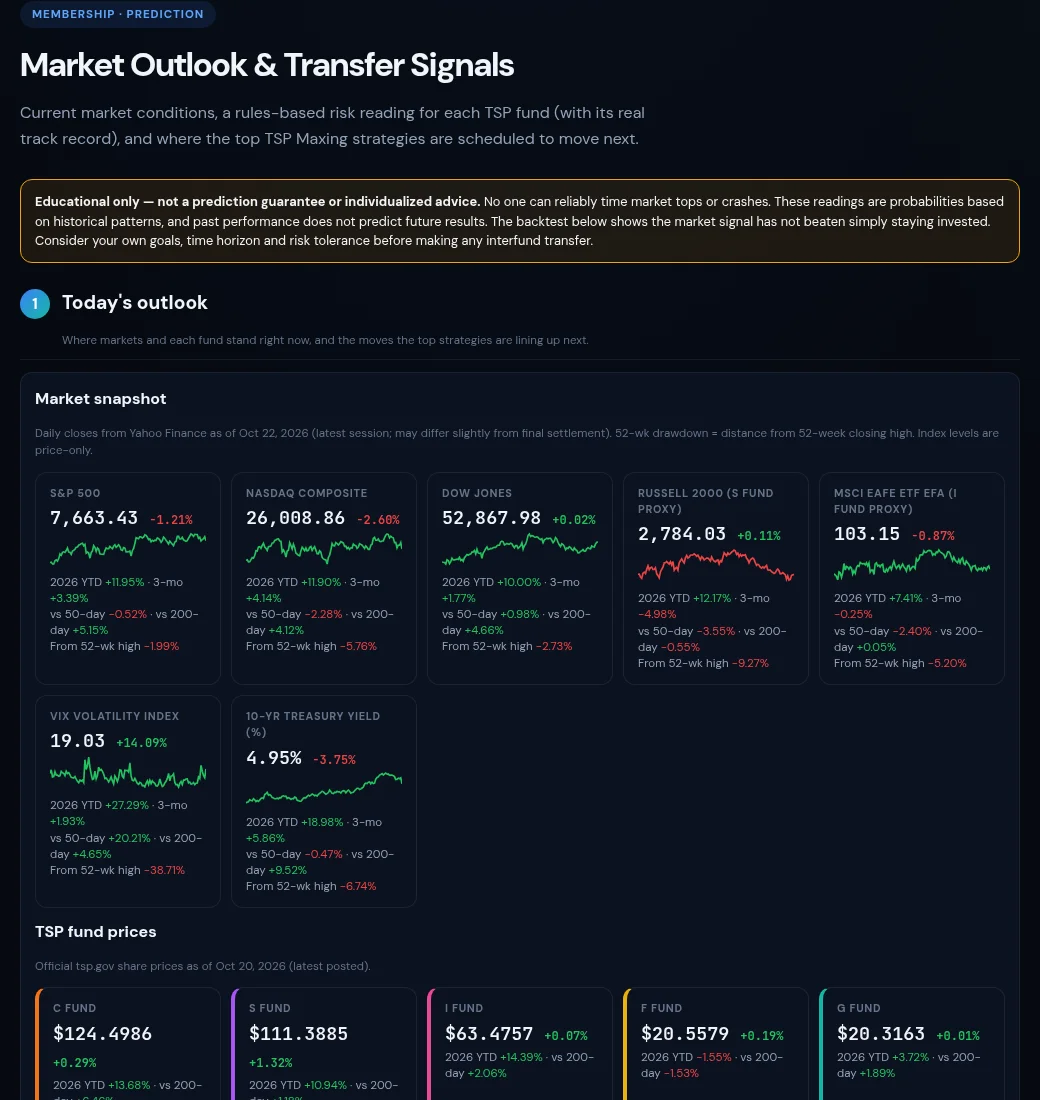
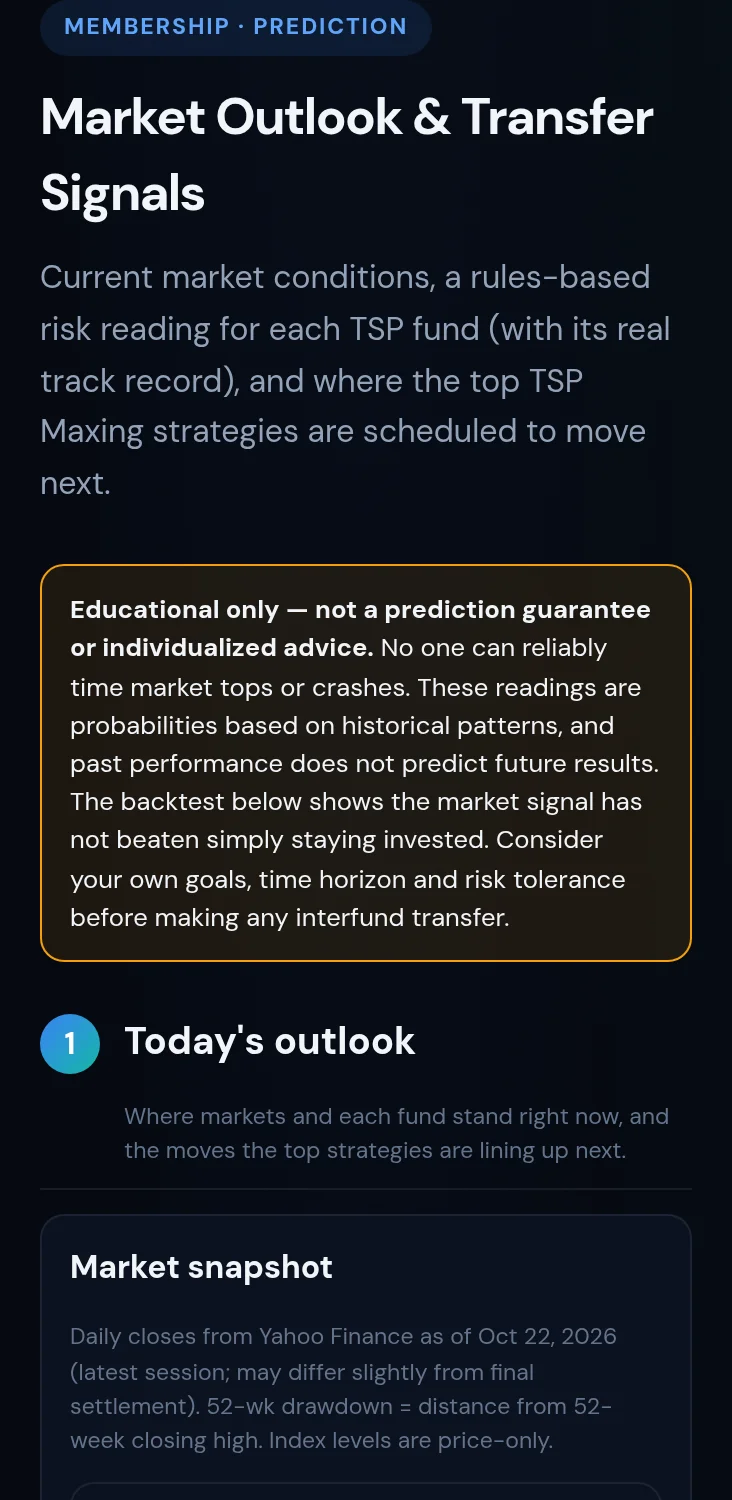
The Prediction tab gives each TSP fund a rules-based market reading every trading day. It shows where the top TSP Maxing strategies are scheduled to move next, all within the 2-IFT monthly limit. Every gauge shows how often it has actually been right since 2003, so you can tell a real edge from a coin flip.
Cancel anytime in one click: Manage or cancel subscription

Built from official daily TSP share prices, plus same-day index proxies where TSP prices lag. Refreshed every trading day.
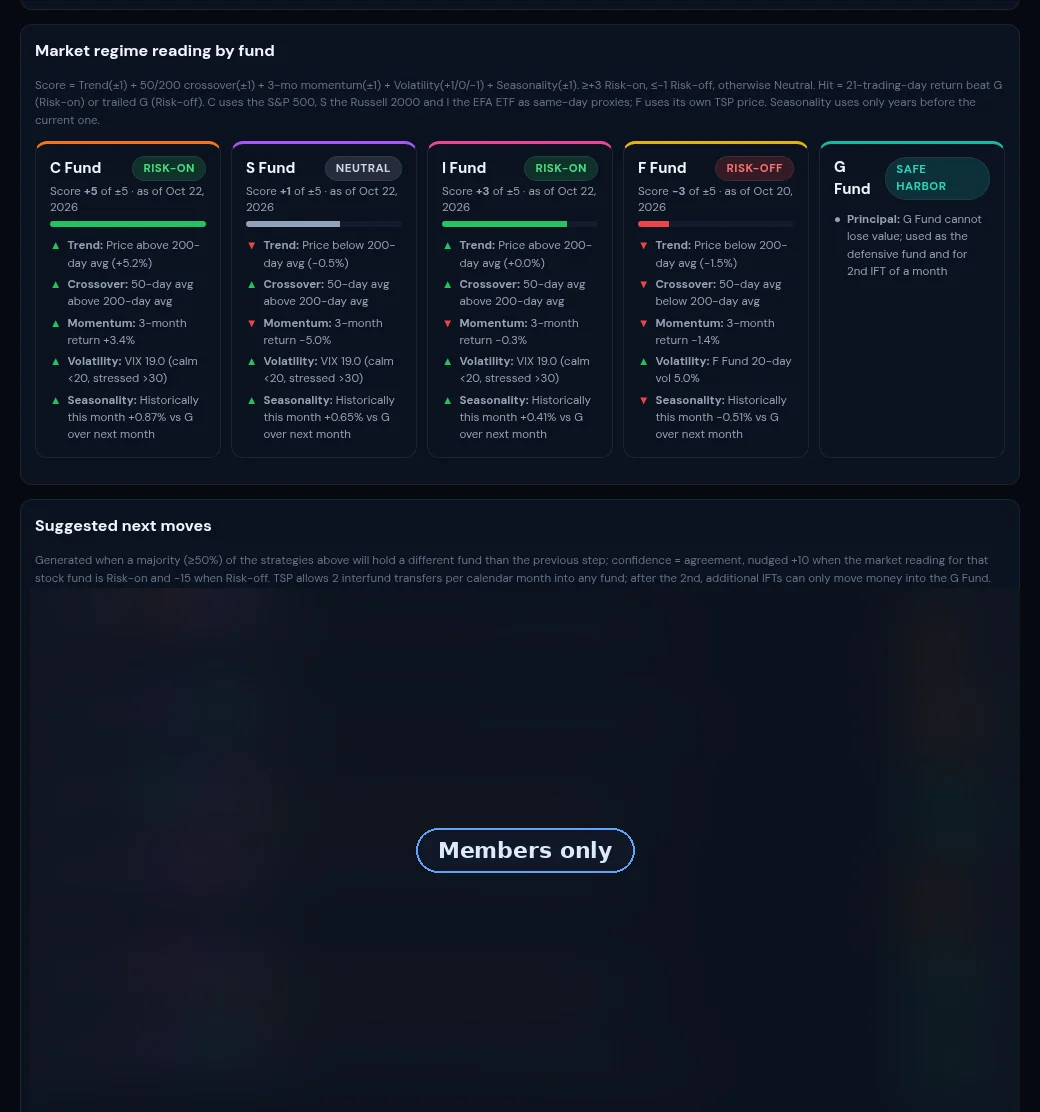
A Risk-on, Neutral or Risk-off reading for C, S, I and F, scored from trend, the 50/200-day crossover, 3-month momentum, volatility and seasonality. G is shown as the safe harbor.
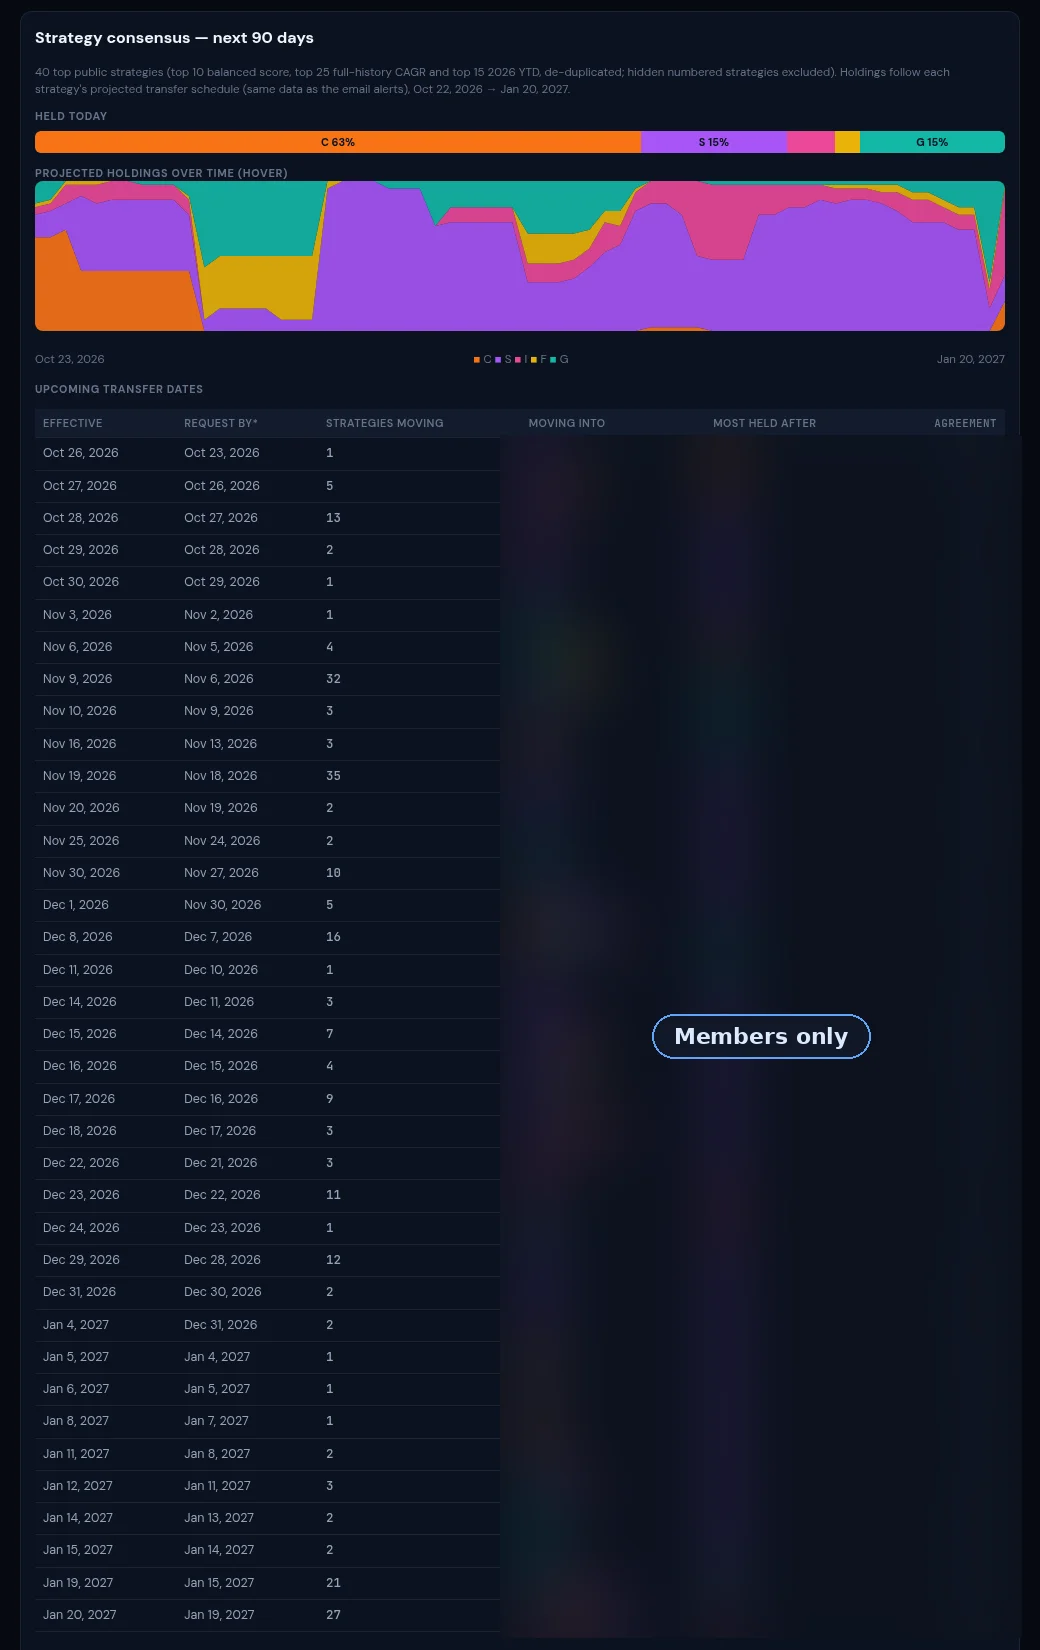
Transfer dates where most of 40 top public strategies agree on a new fund, with a confidence score. Each move is flagged when it would be the 2nd IFT of the month.
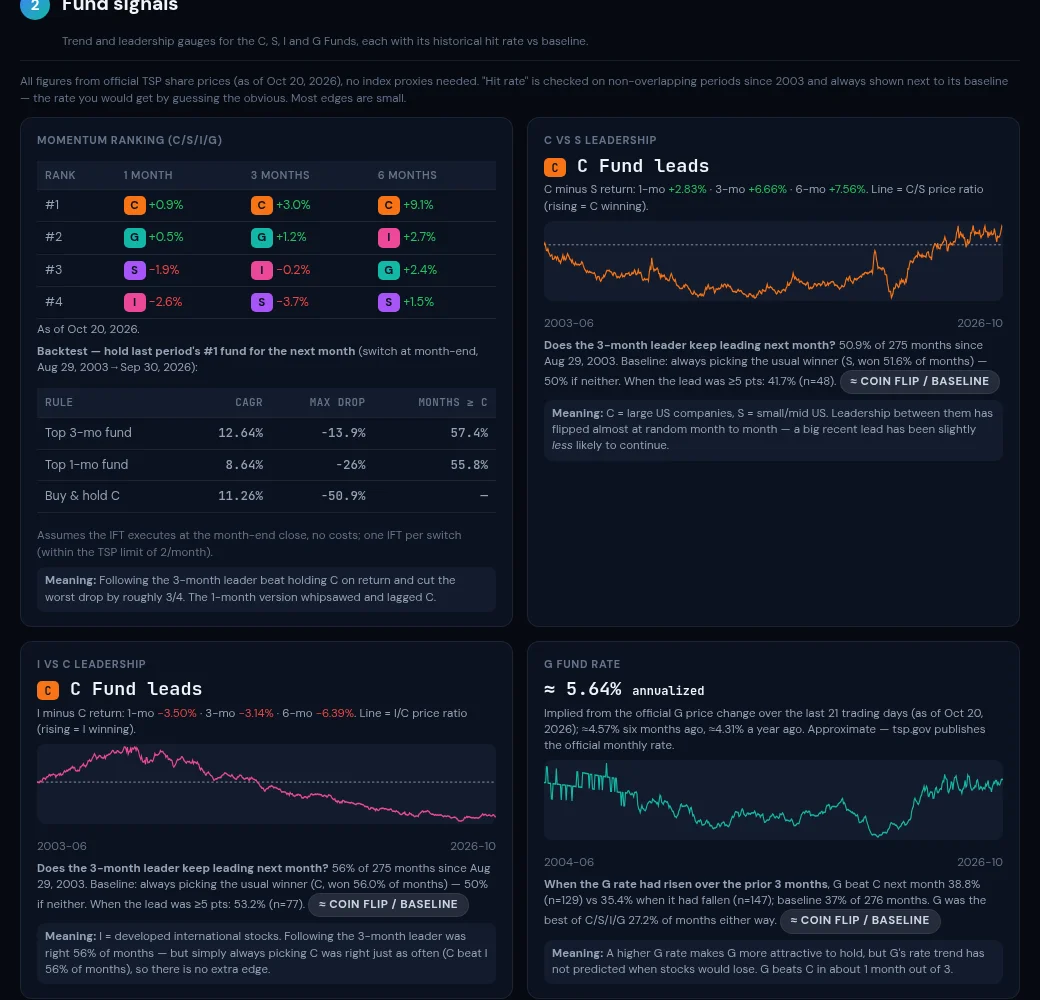
Momentum ranking across C, S, I and G over 1, 3 and 6 months, C vs S and I vs C leadership, and the implied G Fund rate.
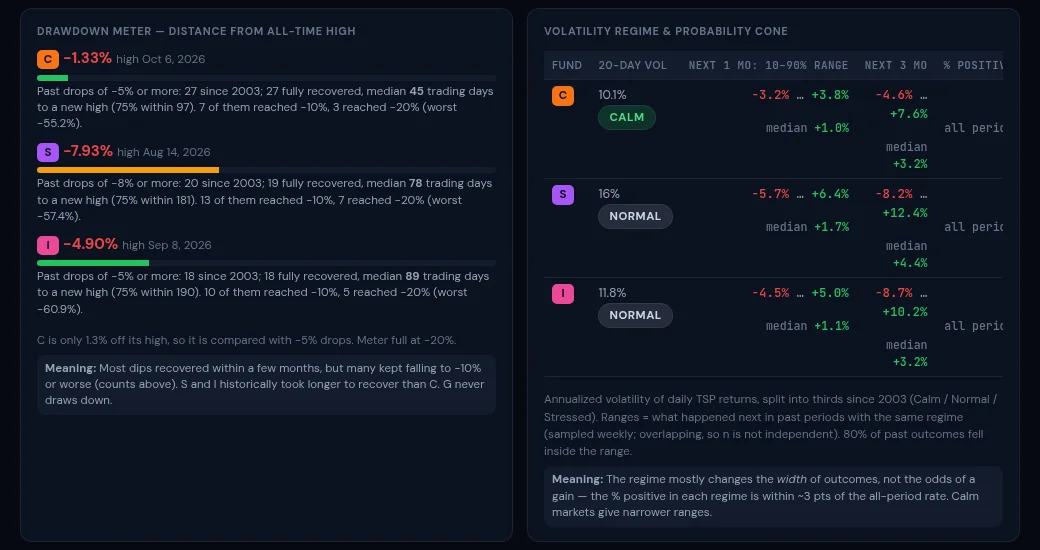
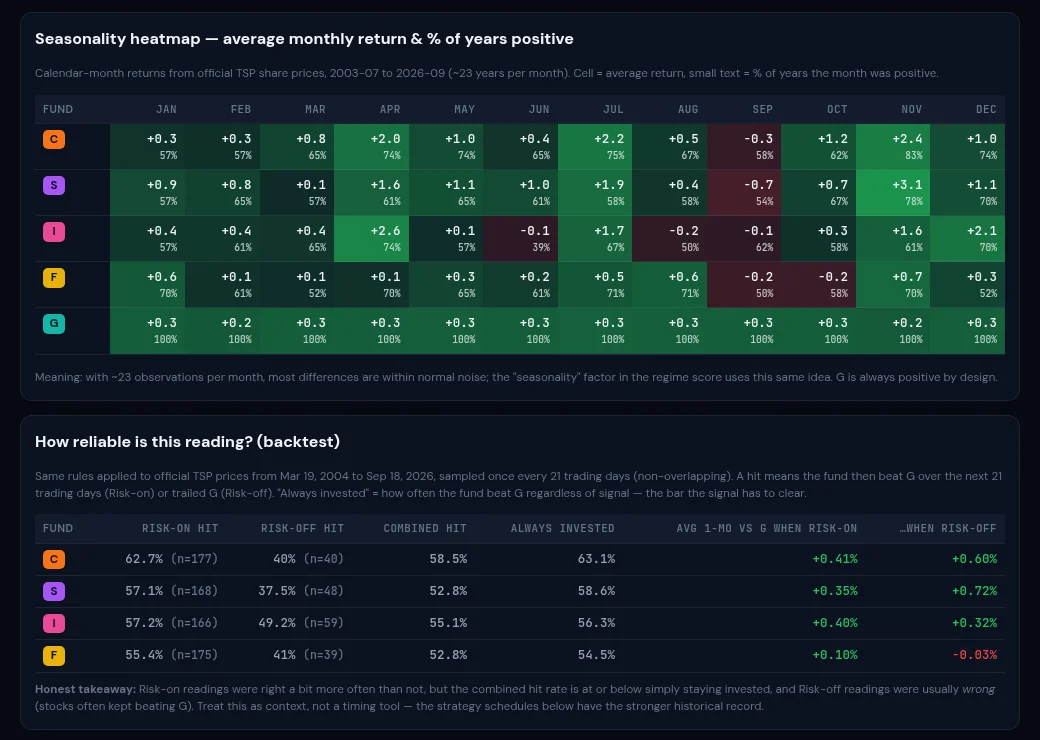
A drawdown meter for each stock fund, the current volatility regime with past next-month ranges, and a seasonality heatmap back to 2003.
Taken from /app on Oct 22, 2026. Upcoming moves and fund calls are blurred for non-members.
Start with the S&P 500, Nasdaq, Dow, Russell 2000, EAFE, VIX and the 10-year yield, each with YTD, 3-month and 52-week-high context. Below them are the latest official C, S, I, F and G share prices.

The momentum table ranks C, S, I and G. Leadership gauges show C vs S and I vs C. Each gauge prints its historical hit rate next to a simple baseline, and says so when that's no better than a coin flip.

See how far C, S and I are from their highs, and how past drops of a similar size played out: how many recovered, how long recovery took, and how many went on to −10% or −20%. The volatility regime shows the range of next-month outcomes seen in similar conditions.

A stacked chart shows which funds the top strategies are projected to hold over the next 90 days. Below it, every upcoming transfer date lists its request-by date and how many strategies move.

The heatmap shows each fund's average return by calendar month, and how often that month was positive, from 2003 to 2026. The reliability table tests the fund readings themselves against simply staying invested.

The whole tab works on mobile, so you can look at the outlook and next transfer date before the 12:00 p.m. ET deadline.

Aug 29, 2003 to Sep 30, 2026 (277 months), official TSP share prices. Assumes the IFT executes at the month-end close, no costs, and one IFT per switch (within the TSP limit of 2 per month). Hypothetical backtest, not actual account returns.
Compound annual growth rate following the 3-month momentum leader among C, S, I and G.
The C Fund held the whole time over the same months.
Versus −50.9% for holding the C Fund. The rule matched or beat C in 57.4% of months.
The faster version whipsawed: −26% worst drop, and it lagged C. We show it anyway.
One page for market context before you think about an interfund transfer.
Upcoming transfer dates and request-by deadlines at a glance, wherever you are.
Every gauge shows its hit rate next to a baseline, so you can judge it for yourself.
Drawdown history and seasonality back to 2003 help keep one bad month in perspective.
Both plans unlock the full members area, including the Prediction tab. Cancel anytime through Stripe.
TSP Maxing tools membership.
The full membership, billed once a year.
Cancel anytime in one click: Manage or cancel subscription
No. No one can reliably time market tops or crashes. The readings are probabilities based on historical patterns, and the tab shows how often each one has been right.
Official daily TSP share prices for the C, S, I, F and G Funds. Same-day market context uses public daily closes (S&P 500, Russell 2000 and the EFA ETF as proxies for C, S and I), labeled as such.
A move appears when a majority of 40 top public TSP Maxing strategies will hold a different fund. Confidence reflects how many strategies agree, adjusted by the market reading. It isn't a probability of profit. Moves are checked against the TSP's 2 interfund transfers per month.
Every trading day.
Not necessarily. All figures are hypothetical backtests on historical prices. Past performance doesn't guarantee future results.
No. TSP Maxing is educational research. It isn't personalized investment, tax or legal advice and isn't official TSP guidance.
Yes. Monthly and Annual are Stripe subscriptions, and you can cancel anytime through Stripe.
Daily fund readings, upcoming transfer dates and the history behind them. Join for $19/mo, or get the best value at $149/yr.
Cancel anytime in one click: Manage or cancel subscription